Fig. 4.
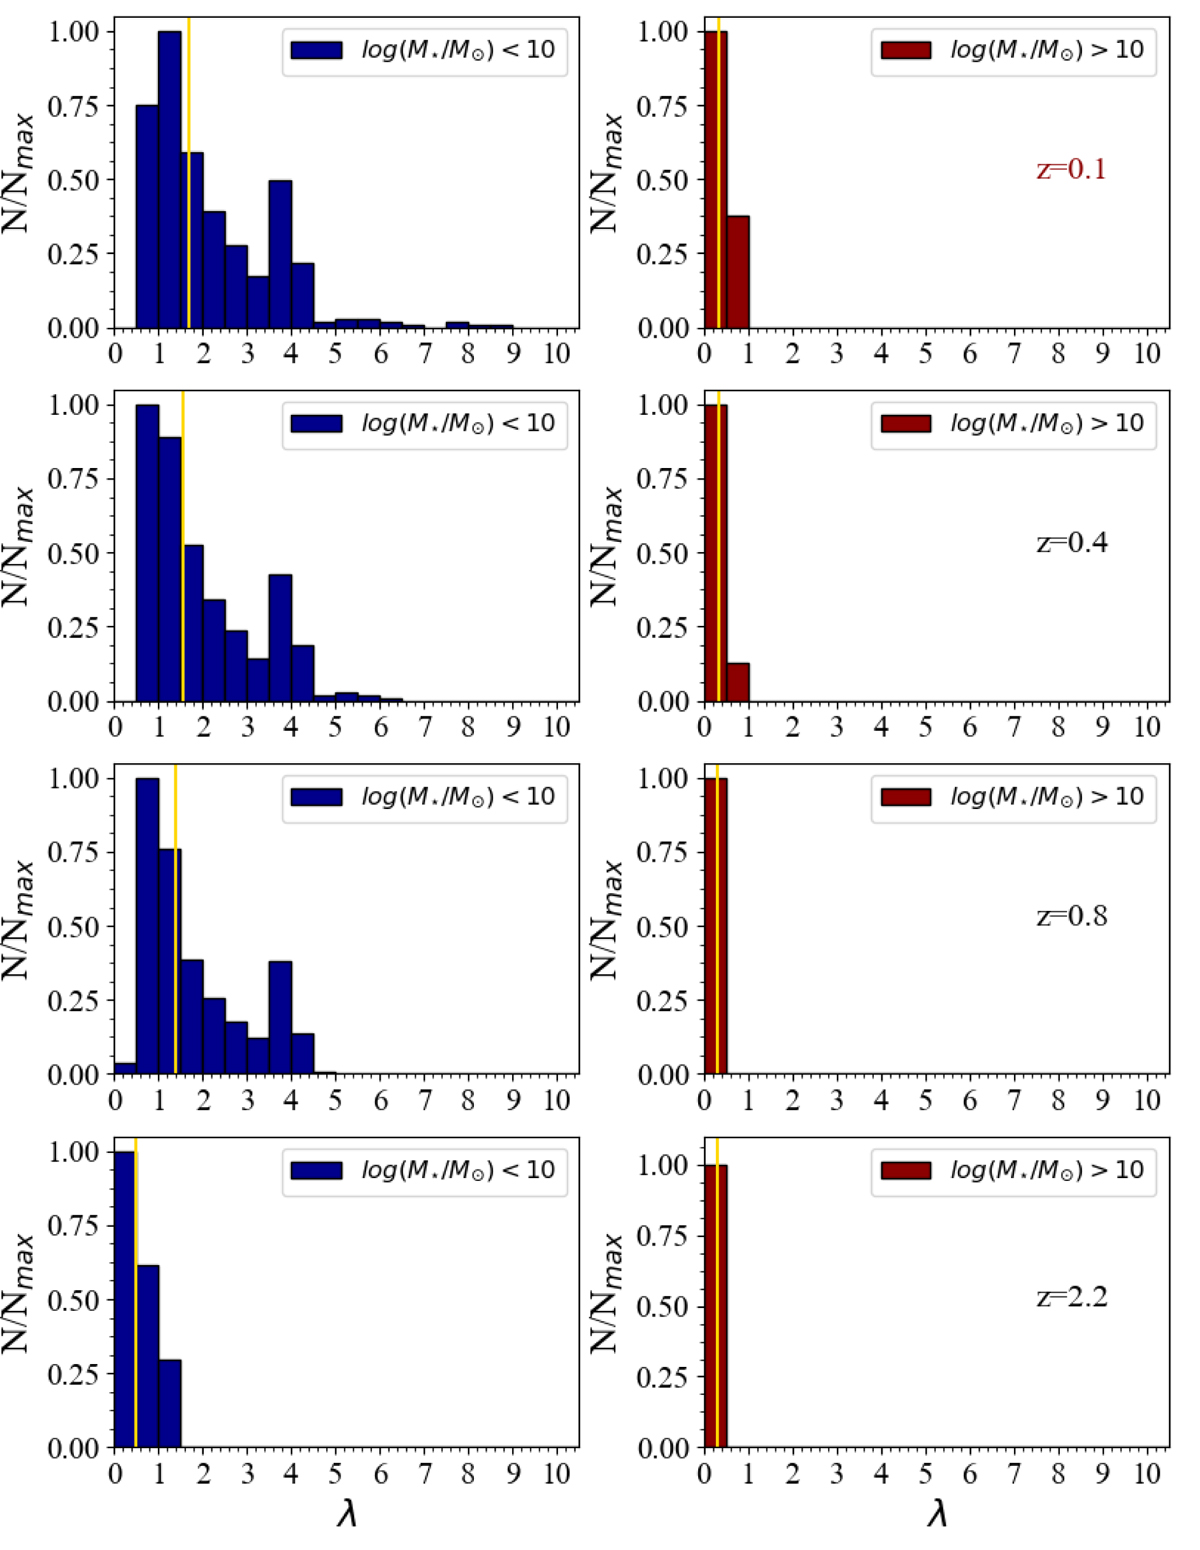
Distribution of the loading factor parameter λ for the galaxies of Fig. 2 computed at redshifts z = 2.2, z = 0.8, z = 0.4, and z = 0.1 for two different bins of stellar mass. The left panels show distributions for objects with stellar mass log(M⋆/M⊙) < 10, and the right panels indicate distributions for stellar mass log(M⋆/M⊙) > 10. The yellow vertical lines indicate the median values of each distribution.
Current usage metrics show cumulative count of Article Views (full-text article views including HTML views, PDF and ePub downloads, according to the available data) and Abstracts Views on Vision4Press platform.
Data correspond to usage on the plateform after 2015. The current usage metrics is available 48-96 hours after online publication and is updated daily on week days.
Initial download of the metrics may take a while.