Fig. 3
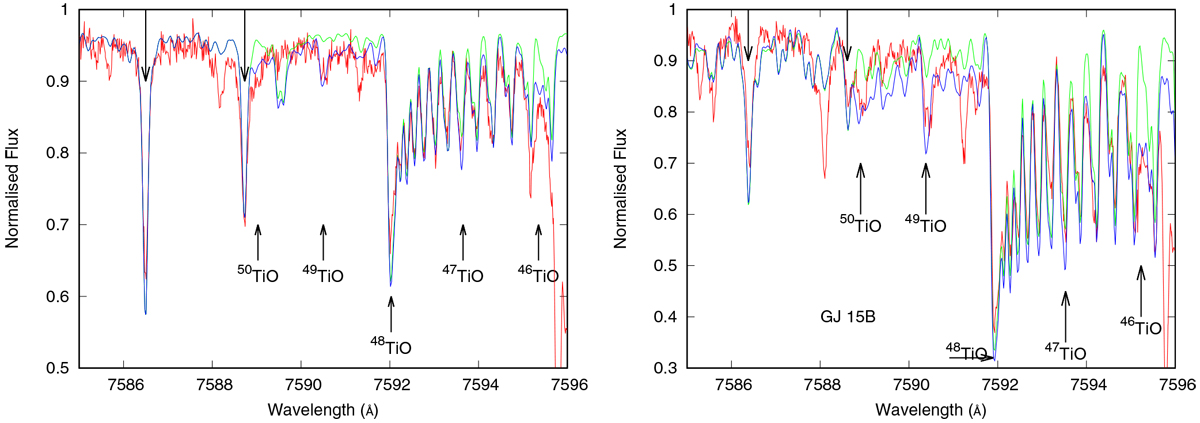
Fits of our synthetic spectra to the observed GJ 15A (left panel) and GJ 15B (right panel) spectra with Ti isotopic ratios 50Ti, 49Ti, 48Ti, 47Ti, and 46Ti of 6.2, 7.9, 72.8, 5.2, and 7.9 and 6.0, 5.8, 76.6, 4.2, and 7.4, respectively, shown by blue lines. Observed spectra are shown by red lines, and fluxes computed for 48Ti O alone are shown by green lines. Downward arrows mark Fe I lines.
Current usage metrics show cumulative count of Article Views (full-text article views including HTML views, PDF and ePub downloads, according to the available data) and Abstracts Views on Vision4Press platform.
Data correspond to usage on the plateform after 2015. The current usage metrics is available 48-96 hours after online publication and is updated daily on week days.
Initial download of the metrics may take a while.