Fig. 2
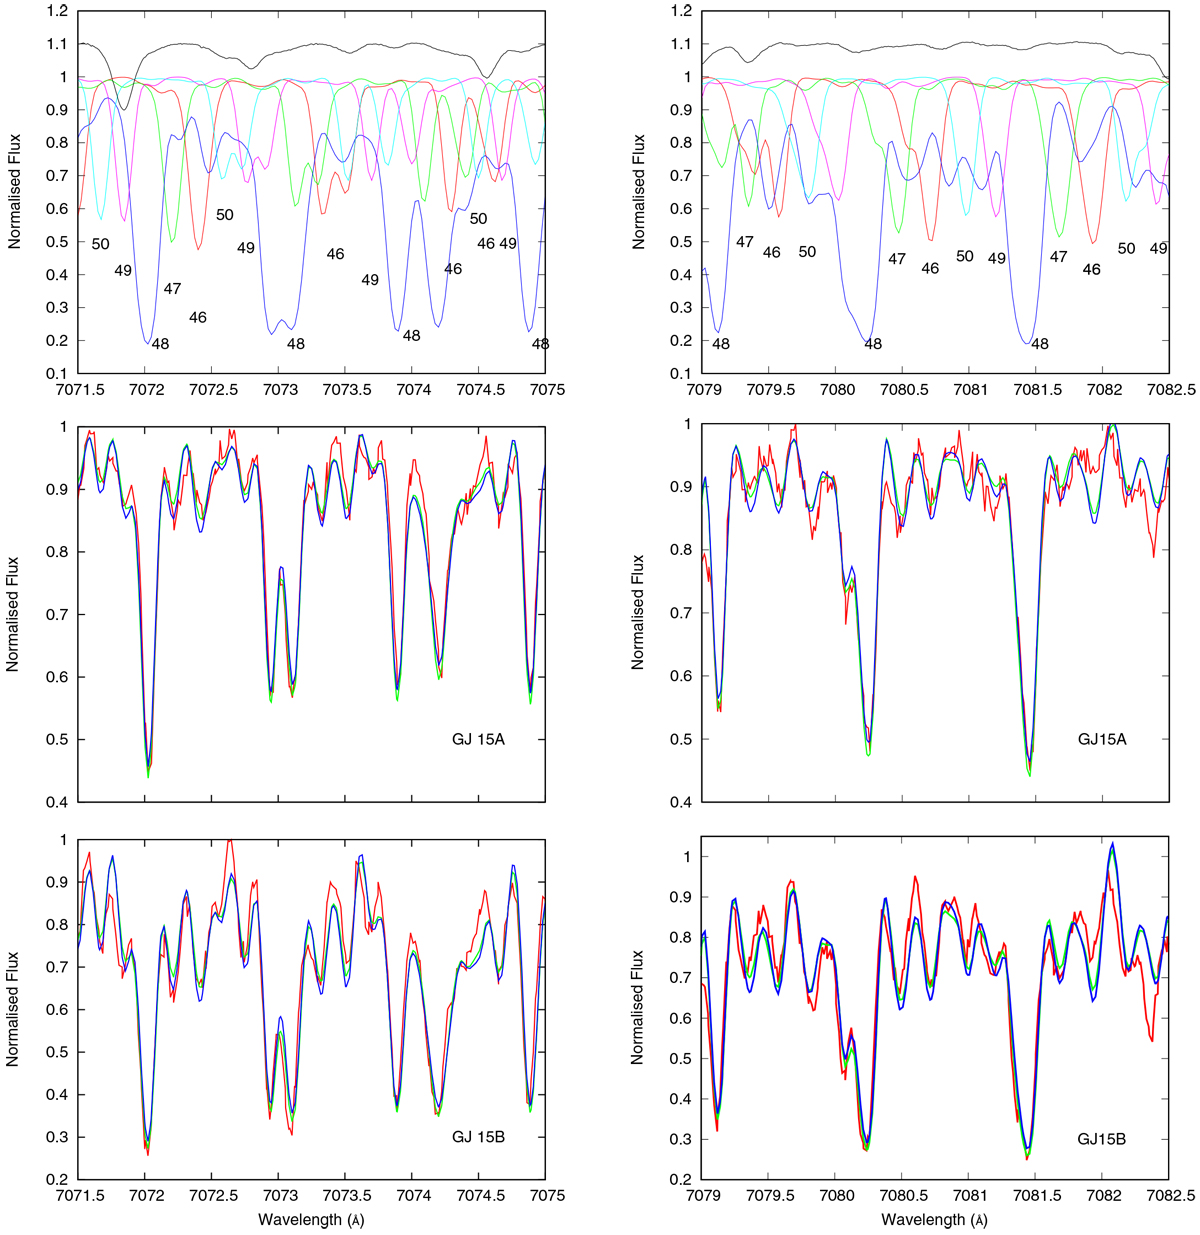
Upper panels: features created by the TiO isotopologues in the spectral ranges used by Lambert & Luck (1977) and Clegg et al. (1979) to determine the Ti isotopic abundance in M-stars. Theoretical spectra of TiO isotopologues were computed for 3500/5.0/0.0 model atmosphere and solar Ti isotopic ratios. Synthetic spectra are convoluted with R = 70 000. The strongest features are marked by atomic numbers of the Ti isotope in the associated TiO molecule. Black line shows the Arcturus spectrum (Hinkle et al. 1995). Middle panels: fits of theoretical spectra computed for 3800/5.0 model atmospheresto the observed spectra of GJ 15A. Bottom panels: fits of theoretical spectra computed for 3500/5.0 model atmospheres to the observed spectra of GJ 15B. Observed spectra are denoted by red lines, spectra computed for the solar isotopic abundance are shown by green lines, and spectra computed for M25 isotopic ratios by blue lines.
Current usage metrics show cumulative count of Article Views (full-text article views including HTML views, PDF and ePub downloads, according to the available data) and Abstracts Views on Vision4Press platform.
Data correspond to usage on the plateform after 2015. The current usage metrics is available 48-96 hours after online publication and is updated daily on week days.
Initial download of the metrics may take a while.