Fig. 1
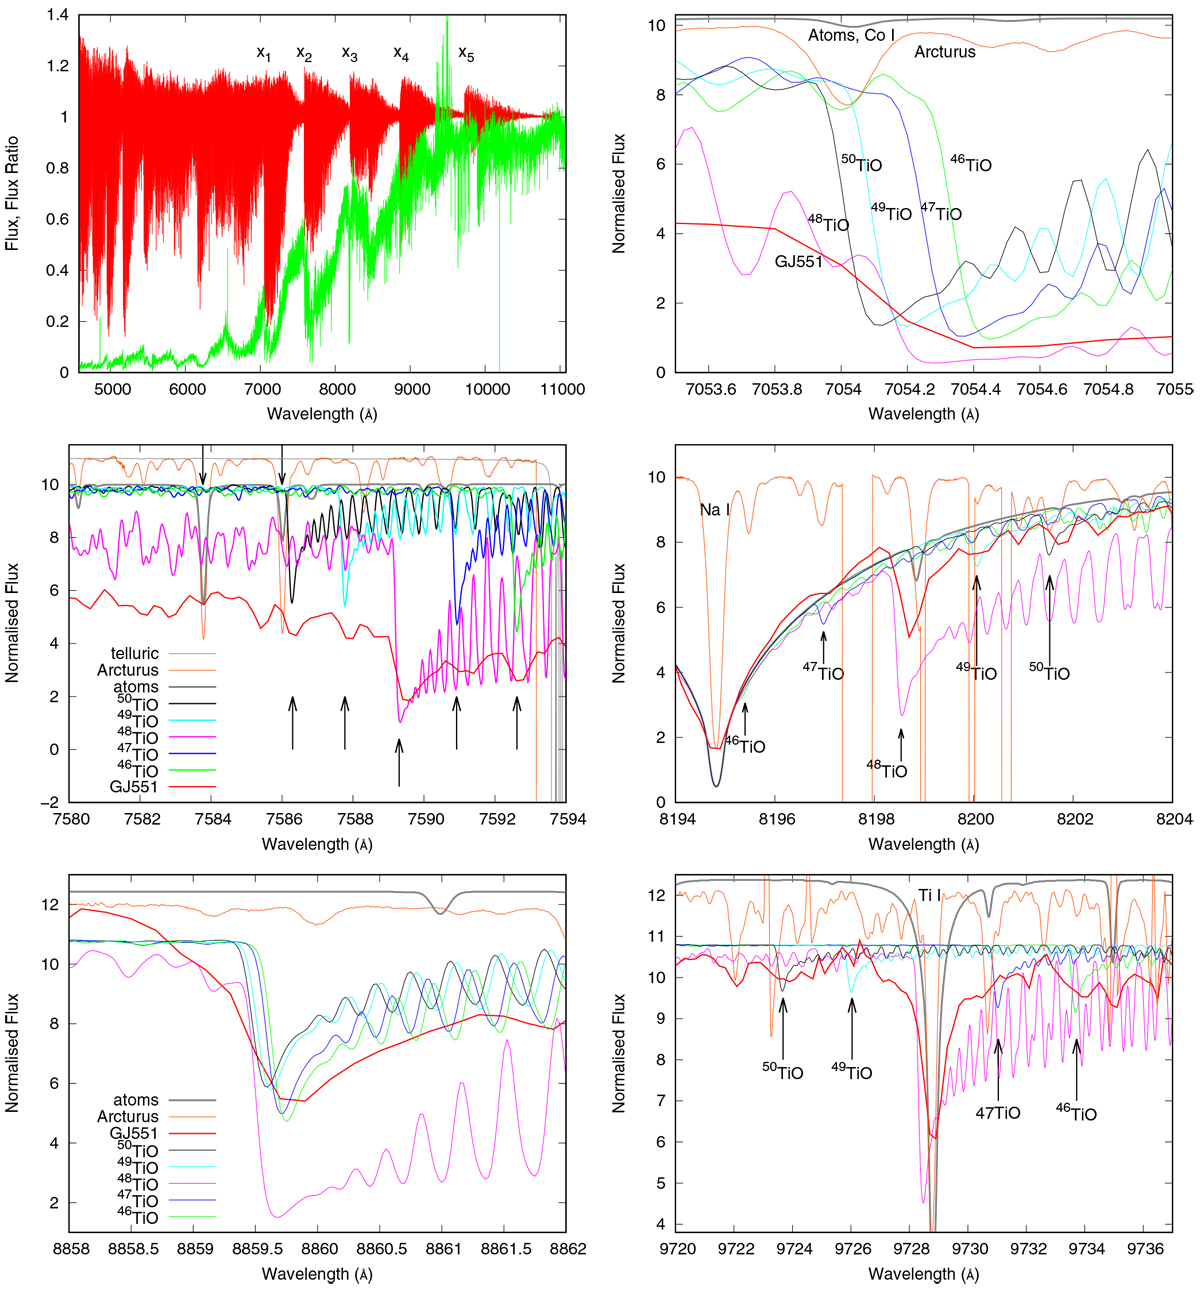
Top left: observed X-shooter spectrum of GJ551 (green line) (Pavlenko et al. 2017) and flux ratio F48 ∕Fall (red line); the green line shows the observed X-shooter fluxes in the Proxima spectrum. x1, ...x5 mark our spectral ranges of interest. Top right: band heads of TiO isotopologues computed for a 2900/4.5/0.0 model atmosphere. All observed spectra are shifted to the zero radial velocity frame. Middle panels: theoretical spectra of bands of TiO isotopologues computed across the x2 it (right panel) and x3 (left panel) spectral ranges. Upward arrows show the positions of head bands of the TiO isotopologues. Downward arrows label two Fe I lines seen in absorption. Bottom panels: theoretical spectra of bands of TiO isotopologues computed across x4 (right panel)and x5 (left panel) spectral ranges. The positions of the molecular band heads are shown by arrows. In all panels the observed spectra of Acturus and Proxima Cen (GJ551) are shown by thin and thick red lines, respectively, to demonstrate the locations of notable atomic and molecular features in the observed spectra.
Current usage metrics show cumulative count of Article Views (full-text article views including HTML views, PDF and ePub downloads, according to the available data) and Abstracts Views on Vision4Press platform.
Data correspond to usage on the plateform after 2015. The current usage metrics is available 48-96 hours after online publication and is updated daily on week days.
Initial download of the metrics may take a while.