Fig. 8.
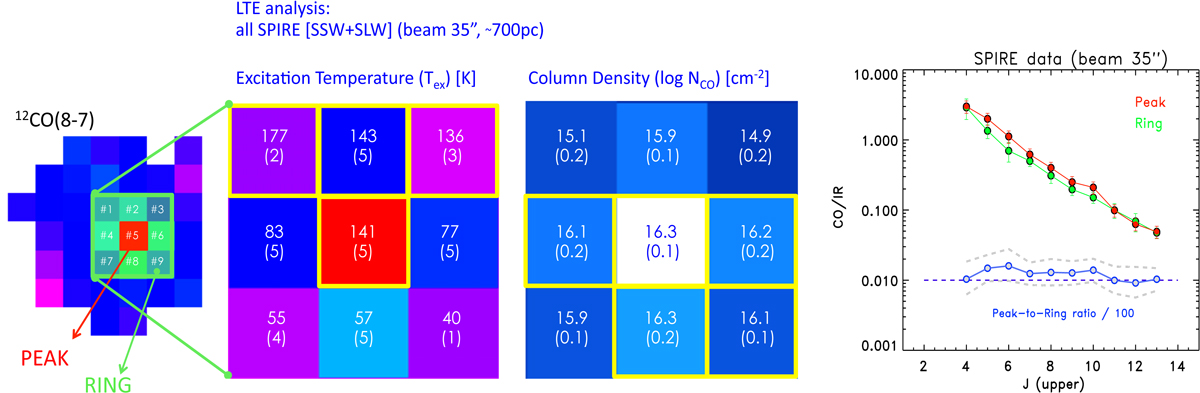
Left:12CO(8–7) emission map showing a FoV of 3 × 3 spaxels (35″ each; light green square) considered when combining the SSW and SLW SPIRE data at the same resolution (i.e., 35″, large spatial scale). The peak emission (in red) and a ring of one spaxel width around that maximum (green area) are identified. Middle: excitation temperatures (Tex) and the (logarithmic) column densities (NCO) are derived for each spaxel using the rotational diagrams. The yellow boxes represent the spectra characterized by high Tex and NCO values. Right:12CO/IR flux ratios computed for the different J transitions in the SPIRE domain. In red are shown the values derived at the position of the flux density peak (spaxel #5 in the left panel) while in green the ratios derived integrating the emission in the ring. The ratio between the maximum peak and the ring for each transition is also shown (i.e., “peak-to-ring ratio”, in blue) divided by 100 (a factor of 100 has to be applied to obtain the real values). The dashed gray lines identify the lower and upper limit values of the peak-to-ring ratios computed within the errors. Higher 12CO/IR values are derived for high J (Jup ≥ 11–10) in the ring structure, implying lower (≲1) peak-to-ring ratios.
Current usage metrics show cumulative count of Article Views (full-text article views including HTML views, PDF and ePub downloads, according to the available data) and Abstracts Views on Vision4Press platform.
Data correspond to usage on the plateform after 2015. The current usage metrics is available 48-96 hours after online publication and is updated daily on week days.
Initial download of the metrics may take a while.