Fig. 7.
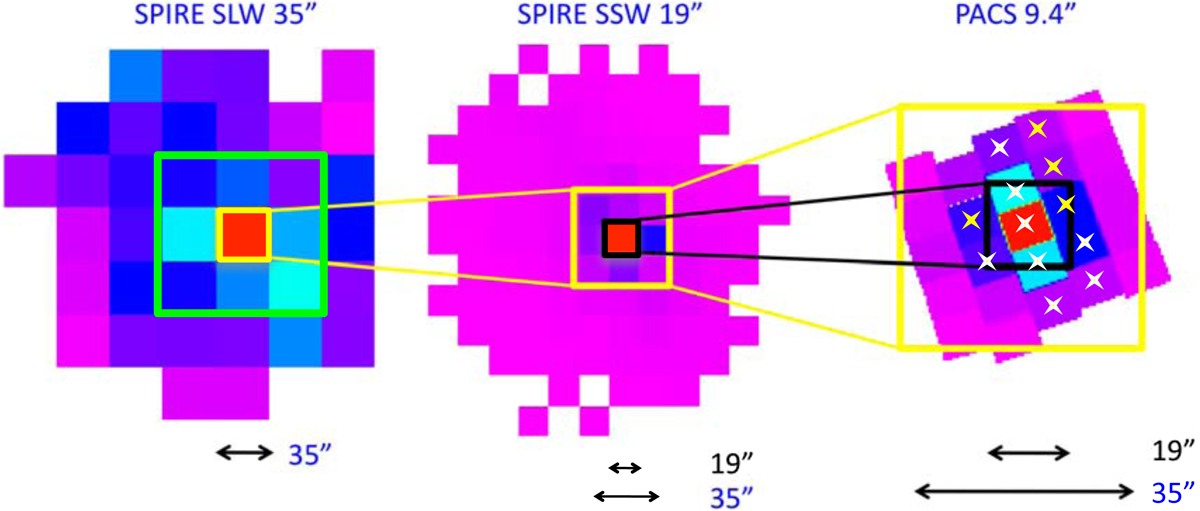
From left to right: schematic view of the different FoVs involved in the analysis of SLW, SSW SPIRE, and PACS data. Left: in the SLW SPIRE map the green square highlights the FoV considered in the analysis (∼100″). These data are characterized by a beam of 35″ identified by the yellow small square. Middle: in the SSW SPIRE map the yellow square represents the 3 × 3 spaxels area involved in the analysis. The map is characterized by a beam of 19″ (small black square). Right: in the PACS map the black square identifies a FoV of ∼19″ (i.e., one SSW SPIRE spaxel) while the yellow square identifies a FoV of ∼35″. The star symbols represent those spaxels where the 12CO emission is observed: in particular, white stars highlight the spaxels characterized by stronger 12CO emission than that observed in the remaining spaxels marked using yellow stars. PACS data are characterized by a beam of 9.4″.
Current usage metrics show cumulative count of Article Views (full-text article views including HTML views, PDF and ePub downloads, according to the available data) and Abstracts Views on Vision4Press platform.
Data correspond to usage on the plateform after 2015. The current usage metrics is available 48-96 hours after online publication and is updated daily on week days.
Initial download of the metrics may take a while.