Fig. 5.
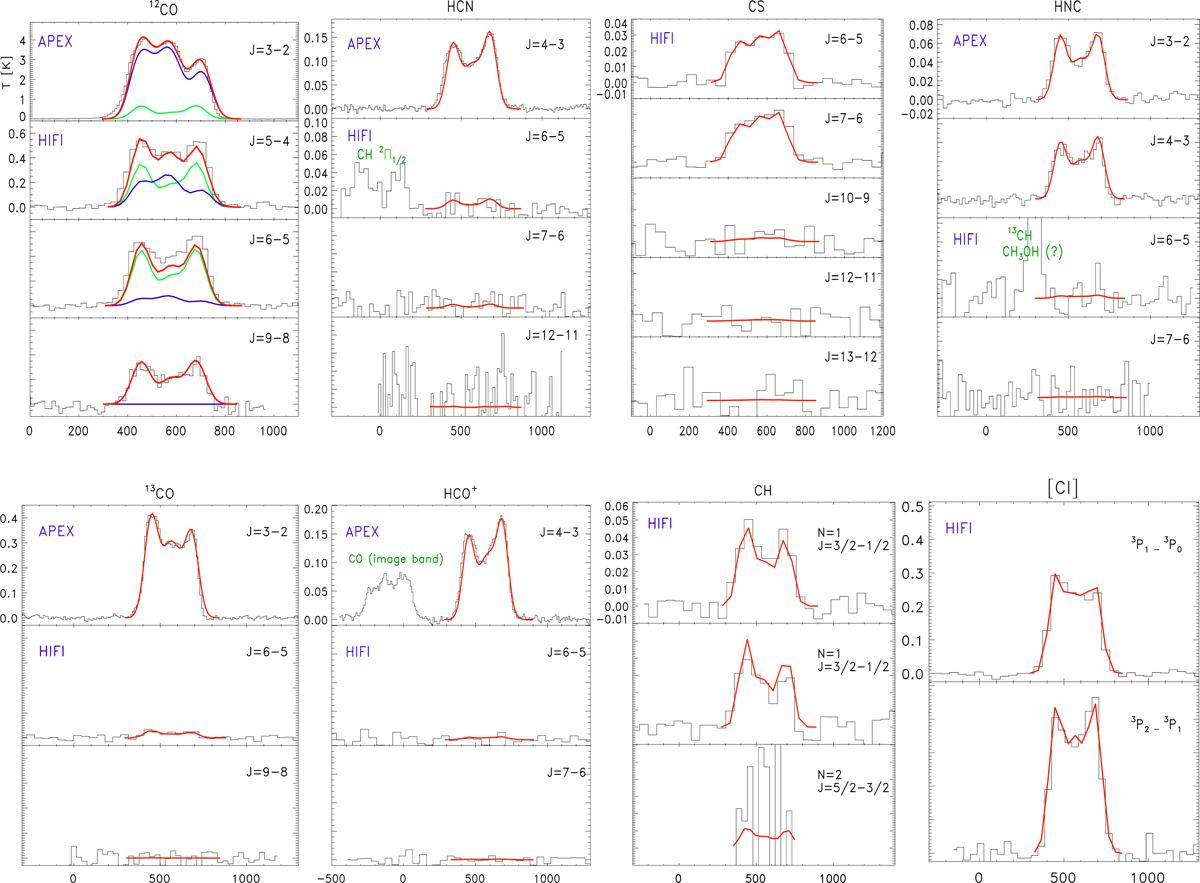
High resolution molecular spectra from APEX and HIFI for all molecules analyzed in this work. The observed spectra and LTE fit obtained using MADCUBA are shown in black and red, respectively. For the 12CO molecule, we highlight a cold (blue) and a hot (green) component because two temperature components were needed to properly fit the emission. For each APEX (Jup ≤ 4) and HIFI (Jup≥ 5–9) spectrum, the J transitions are identified. Other detected molecular species like CH, 13CH and 12CO (in the image band) are shown in green. For each molecule the range in temperature is the same for all J (APEX and HIFI) transitions with the exception of 12CO and HCN, which show different ranges to better appreciate the fainter emission of the HIFI data. The emission is shown in main beam temperature (TMB) in kelvin.
Current usage metrics show cumulative count of Article Views (full-text article views including HTML views, PDF and ePub downloads, according to the available data) and Abstracts Views on Vision4Press platform.
Data correspond to usage on the plateform after 2015. The current usage metrics is available 48-96 hours after online publication and is updated daily on week days.
Initial download of the metrics may take a while.