Free Access
Fig. 2.
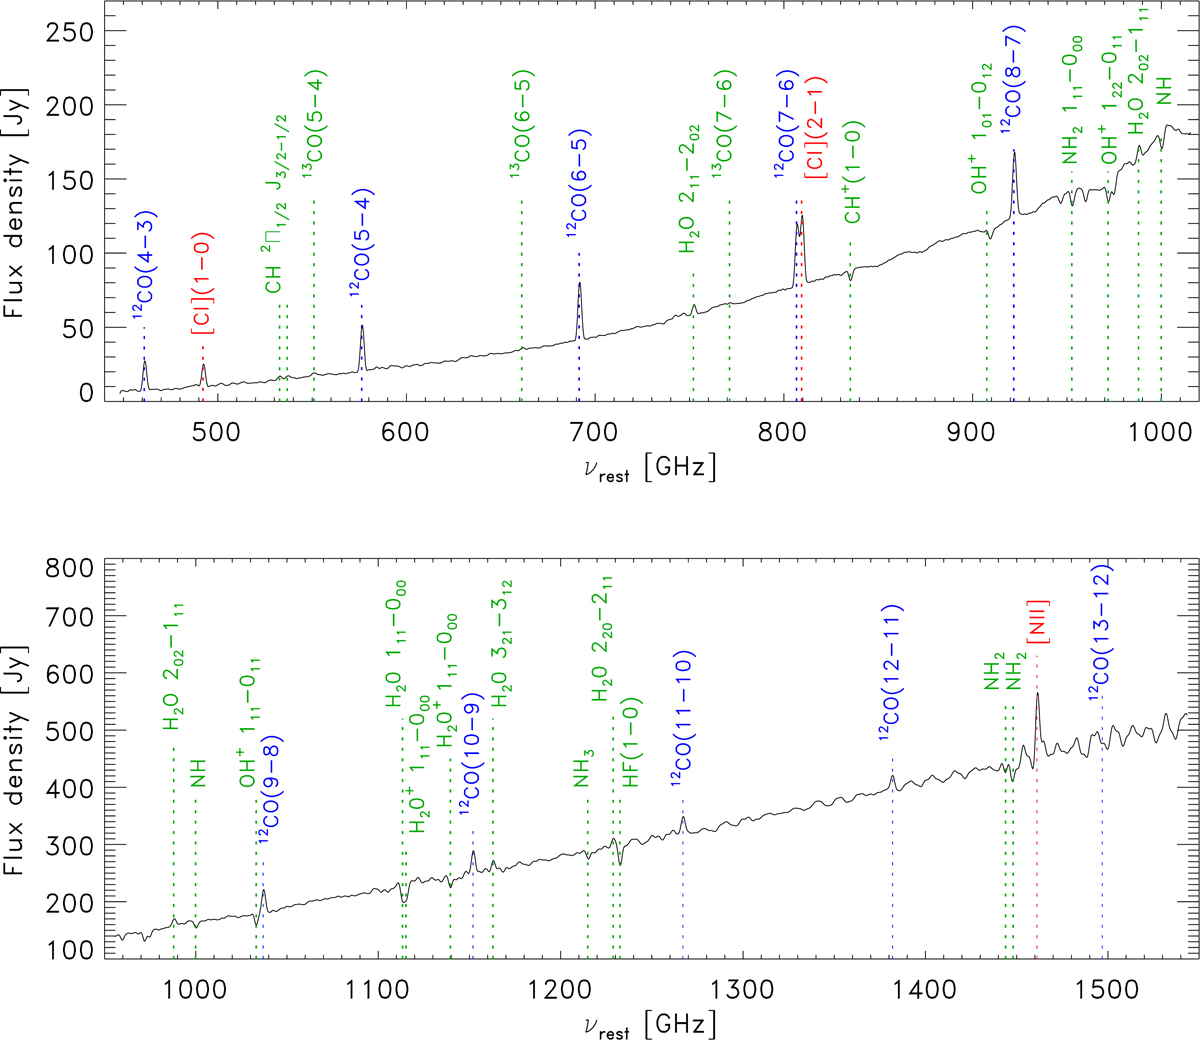
SLW (upper panel) and SSW SPIRE (lower panel) spectra corresponding to the peak emission in the same FoV in the rest-frame frequency. 12CO lines are shown in blue while fine structure lines, such as [CI] and [NII], are indicated in red. Other molecular species observed in emission and/or absorption are shown in green.
Current usage metrics show cumulative count of Article Views (full-text article views including HTML views, PDF and ePub downloads, according to the available data) and Abstracts Views on Vision4Press platform.
Data correspond to usage on the plateform after 2015. The current usage metrics is available 48-96 hours after online publication and is updated daily on week days.
Initial download of the metrics may take a while.