Fig. 16.
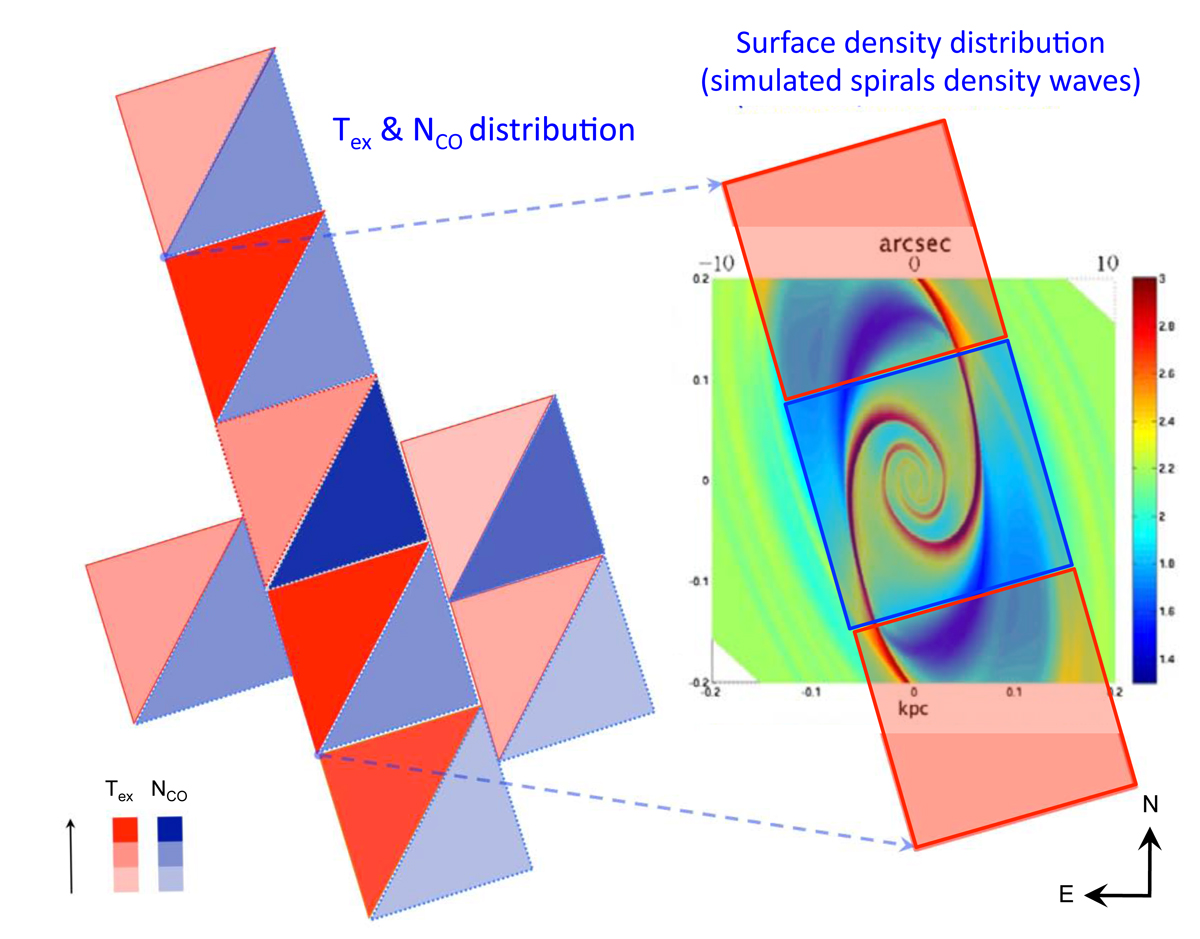
Comparison between the results obtained at small scales using PACS (left) with those derived in Lin et al. (2011) (right). Left: excitation temperature (Tex; red colors) and column density (log NCO; blue colors) values derived using PACS data for the inner spaxels. The highest temperatures are found in correspondence of the two spaxels closed to the nucleus, in the northern and southern directions, while the peak in the column density is found in the central spaxel. Right (back): simulated spiral density waves overplotted to the velocity structure (Lin et al. 2011) in a FoV of 20″ × 20″. High density values are in red while lower values are in blue. Right (front): corresponding PACS spaxels overplotted onto the same FoV to show the respective excitation temperature distribution derived from PACS data. Higher values of the simulated density map reveal a pair of tightly wound spirals in the center which correspond to the highest NCO and lower Tex in PACS data. On the other hand, lower values in the surface density correspond to higher Tex and lower NCO according to PACS. North is at the top and East to the left.
Current usage metrics show cumulative count of Article Views (full-text article views including HTML views, PDF and ePub downloads, according to the available data) and Abstracts Views on Vision4Press platform.
Data correspond to usage on the plateform after 2015. The current usage metrics is available 48-96 hours after online publication and is updated daily on week days.
Initial download of the metrics may take a while.