Free Access
Fig. 12.
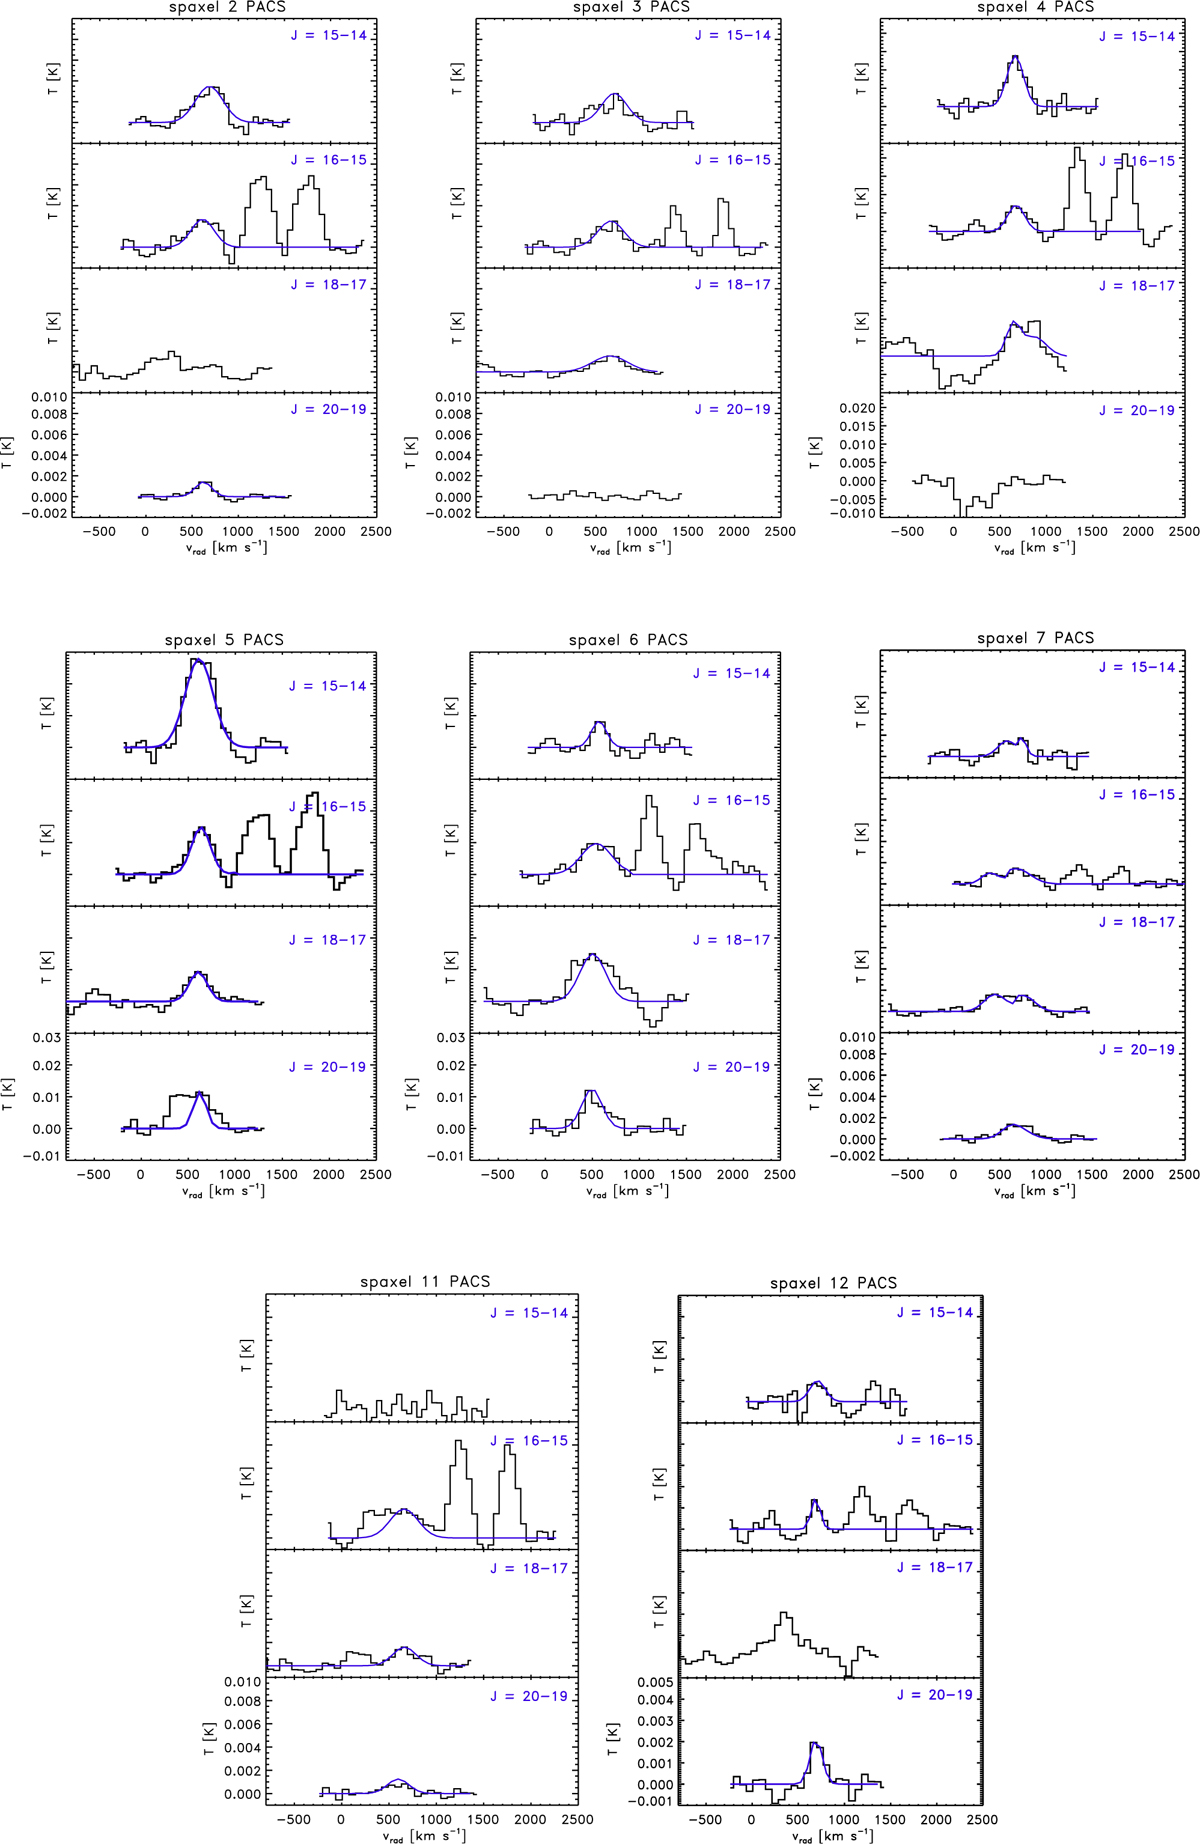
Left: observed 12CO PACS spectra (black) along with the simulated Gaussian fit results (blue). The respective rotational transition (J + 1 → J) is shown for each spectrum. The flux emission is shown in main beam temperature (TMB). The OH emission lines close to the 12CO(16–15) transition are also observed (see Fig. 9).
Current usage metrics show cumulative count of Article Views (full-text article views including HTML views, PDF and ePub downloads, according to the available data) and Abstracts Views on Vision4Press platform.
Data correspond to usage on the plateform after 2015. The current usage metrics is available 48-96 hours after online publication and is updated daily on week days.
Initial download of the metrics may take a while.