Fig. 11.
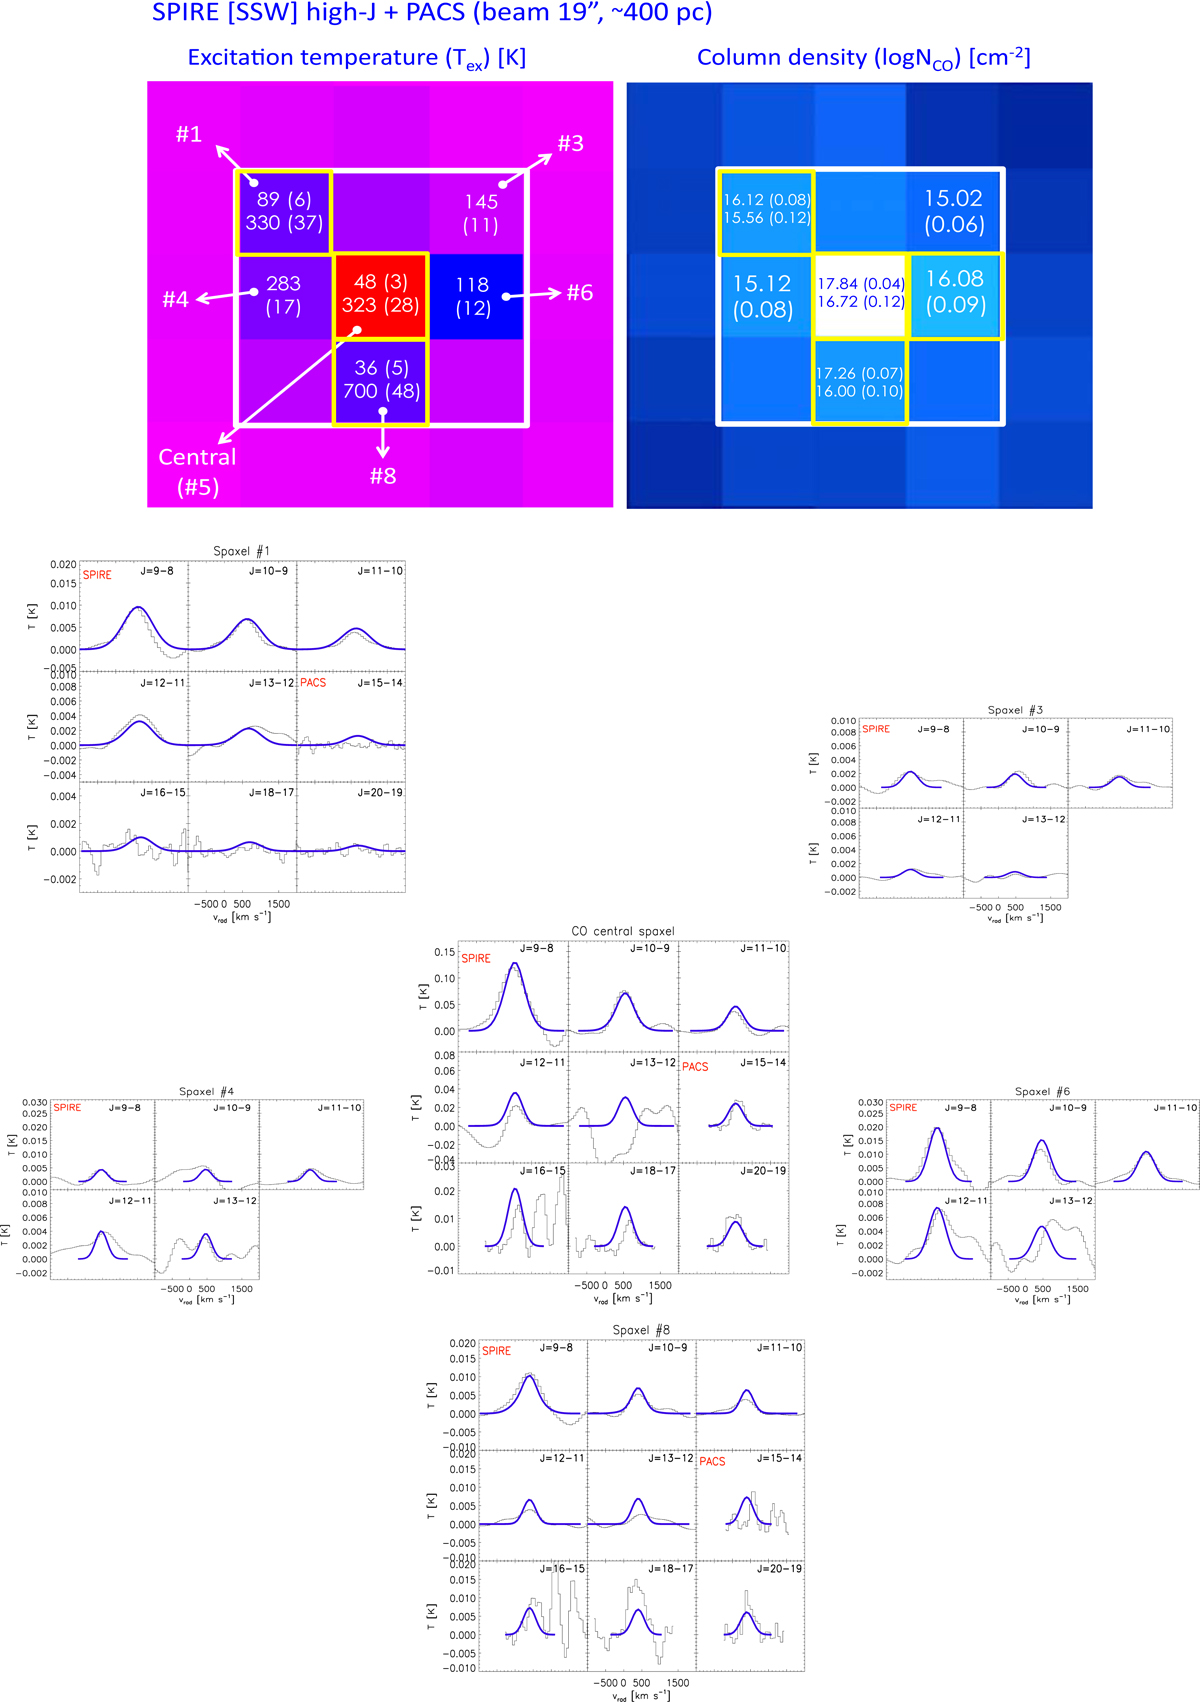
LTE results derived combining SSW SPIRE and PACS spectra. Top: distribution of the excitation temperature (Tex, top left) and column density (NCO, top right) derived applying MADCUBA to the combined SSW SPIRE and PACS spectra. The FoV covered by 3 × 3 spaxels (∼1′ × 1′) is the same as that shown in Fig. 10. Bottom: observed (black) and simulated (blue) 12CO emission spectra from combining SSW SPIRE and PACS. The spaxels are identified using the same number used in the top panel. For spaxels #3 and #6 only SPIRE data are available while for spaxels #1, #5 (central), and #8 SSW SPIRE and PACS data are combined together. The 12CO emission is found in the inner region (3 × 3 spaxels) and mainly located in the disk, with some contribution in the perpendicular direction.
Current usage metrics show cumulative count of Article Views (full-text article views including HTML views, PDF and ePub downloads, according to the available data) and Abstracts Views on Vision4Press platform.
Data correspond to usage on the plateform after 2015. The current usage metrics is available 48-96 hours after online publication and is updated daily on week days.
Initial download of the metrics may take a while.