Fig. 10.
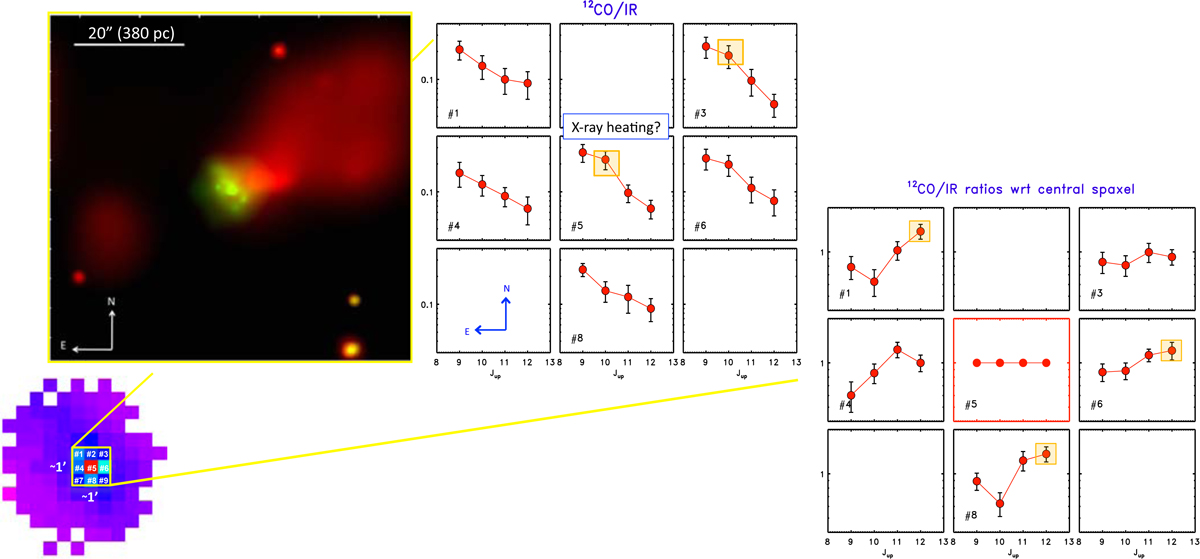
Bottom left:SPIRE SSW12CO emission maps showing the nine spaxels involved in the analysis. Top left: hard (green) and soft (red) X-ray emission from Chandra from Marinucci et al. (2012) of the outflow observed in the central region (∼1′ × 1′) in NGC 4945. Middle:12CO/IR results obtained using SSW SPIRE data (19″ beam) numbered following the scheme shown in the bottom-left panel. Right:12CO/IR results normalized to the emission of the central spaxel (red square).
Current usage metrics show cumulative count of Article Views (full-text article views including HTML views, PDF and ePub downloads, according to the available data) and Abstracts Views on Vision4Press platform.
Data correspond to usage on the plateform after 2015. The current usage metrics is available 48-96 hours after online publication and is updated daily on week days.
Initial download of the metrics may take a while.