Fig. 1.
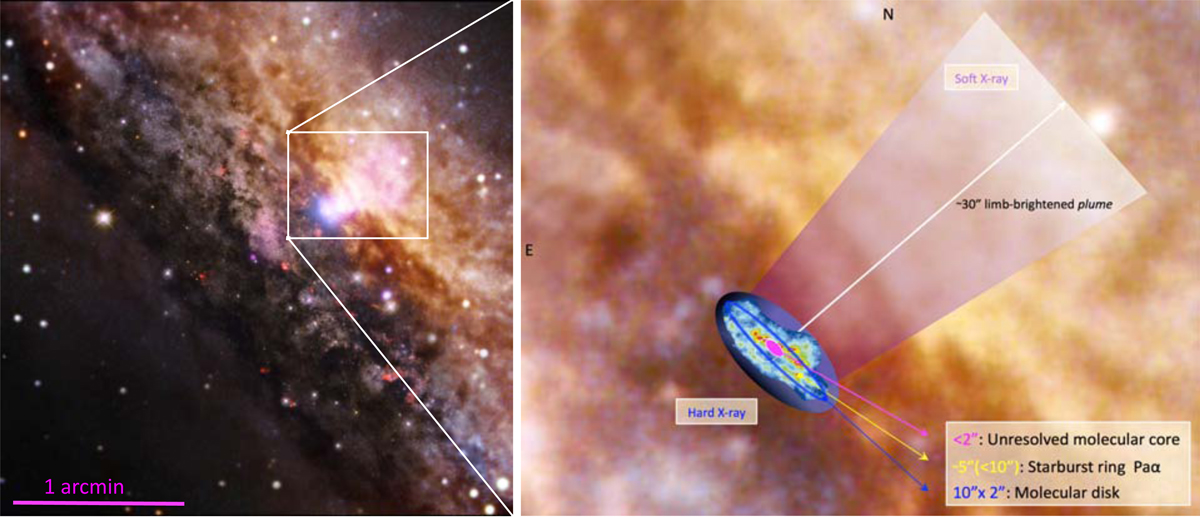
Left: combined image of X-ray emission from Chandra (low energy: magenta, high energy: blue) overlaid on an optical image from ESO. Credits from NASA/CXC/Univ degli Studi Roma Tre/Marinucci et al. (2012), Optical: ESO/VLT & NASA/STScI. Right: cartoon of the central region (<1 kpc) of NGC 4945. The optical image shown in the left panel is used as the background. The size (diameter) of the different components observed in the (soft and hard) X-ray, NIR, and radio bands are highlighted: the limb-brightening “plume” in soft X-rays as well as the nuclear hard X-ray emission region (Marinucci et al. 2012), the starburst ring in Paα (Marconi et al. 2000), and the nuclear molecular disk along with the unresolved molecular core (Henkel et al. 2018).
Current usage metrics show cumulative count of Article Views (full-text article views including HTML views, PDF and ePub downloads, according to the available data) and Abstracts Views on Vision4Press platform.
Data correspond to usage on the plateform after 2015. The current usage metrics is available 48-96 hours after online publication and is updated daily on week days.
Initial download of the metrics may take a while.