Fig. 4.
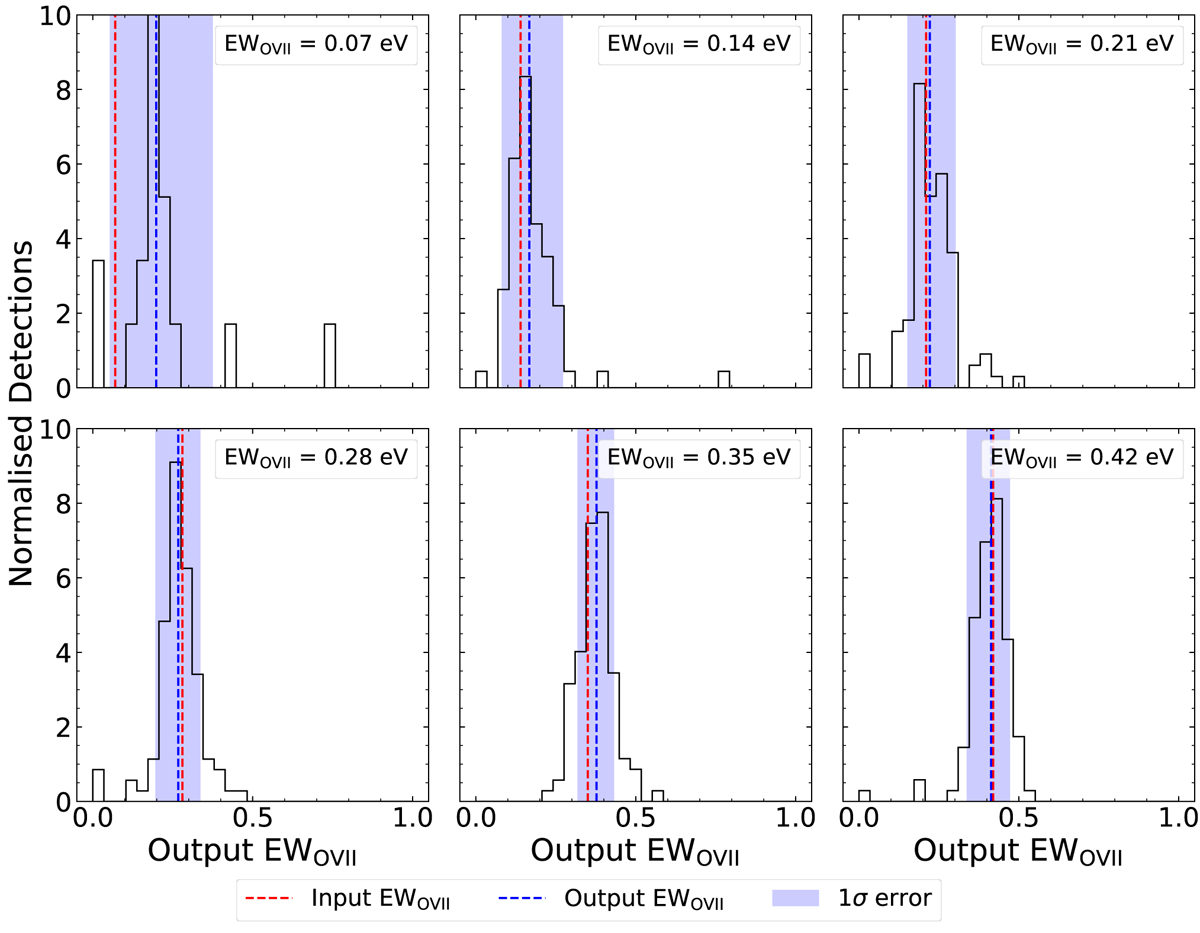
Distributions of the fitted O VII equivalent widths in eV for each input O VII equivalent width from GRB afterglow spectra with F ≥ 5 × 10⁻¹¹ erg cm−2 s−1. The input equivalent width is represented by the red dashed line and the median equivalent width of the distribution is shown by the blue dashed line. The blue shaded area is the 1σ interval of the distribution.
Current usage metrics show cumulative count of Article Views (full-text article views including HTML views, PDF and ePub downloads, according to the available data) and Abstracts Views on Vision4Press platform.
Data correspond to usage on the plateform after 2015. The current usage metrics is available 48-96 hours after online publication and is updated daily on week days.
Initial download of the metrics may take a while.