Fig. 9
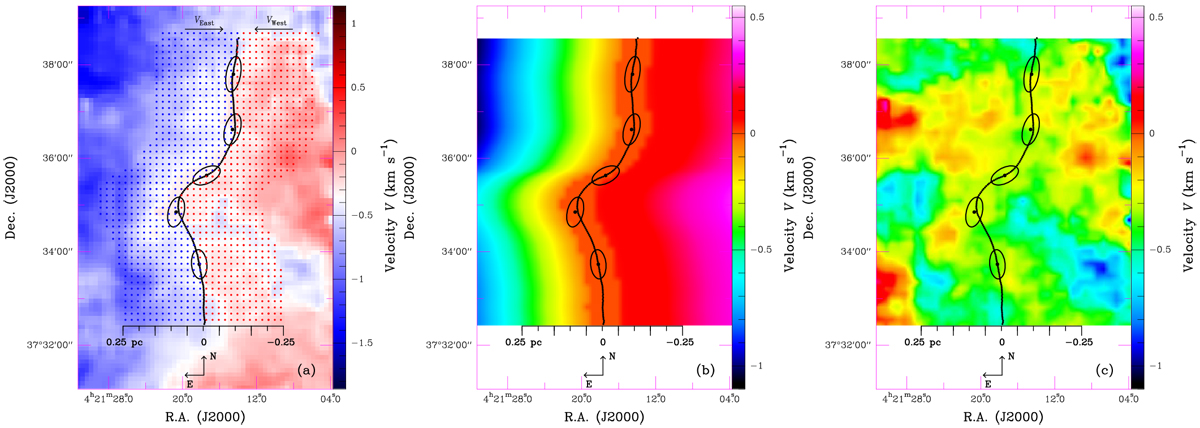
Views of the transverse velocity gradient across filament 8. Panel a: map of centroid velocities observed in 13 CO (2−1), shown from VLSR = −1.86 km s −1 (blue) to VLSR = +1.14 km s −1 (red). The crest of the filament is marked by a black line. The cores identified with getsources are shown by black ellipses, whose sizes correspond to the (major and minor) FWHM diameters of the equivalent Gaussian sources. Panel b: map of the linear transverse-velocity gradient model fitted on the blue-shifted eastern side (2.17 × Xoffset km s−1) and the red-shifted western side (0.74 × Xoffset km s−1) of the filament. Panel c: map of centroid velocities obtained after subtracting the transverse velocity gradient.
Current usage metrics show cumulative count of Article Views (full-text article views including HTML views, PDF and ePub downloads, according to the available data) and Abstracts Views on Vision4Press platform.
Data correspond to usage on the plateform after 2015. The current usage metrics is available 48-96 hours after online publication and is updated daily on week days.
Initial download of the metrics may take a while.