Fig. 8
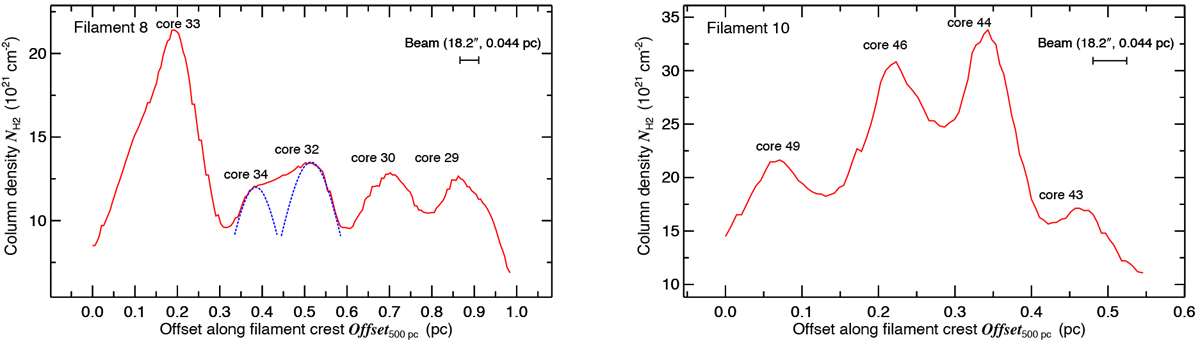
Longitudinal column density profiles of filament 8 (left panel) and filament 10 (right panel). In both cases, the column density profiles (red curves) were obtained from the original high-resolution (18.2″) column density map. Left panel: cores # 32 and 34 partly overlap and they were deblended by getsources using an iterative method. The inferred structure of these two cores is shown by the blue-dashed Gaussian profiles. The four cores in the right panel are clearly separated from one another and they did not require any deblending.
Current usage metrics show cumulative count of Article Views (full-text article views including HTML views, PDF and ePub downloads, according to the available data) and Abstracts Views on Vision4Press platform.
Data correspond to usage on the plateform after 2015. The current usage metrics is available 48-96 hours after online publication and is updated daily on week days.
Initial download of the metrics may take a while.