Fig. 6
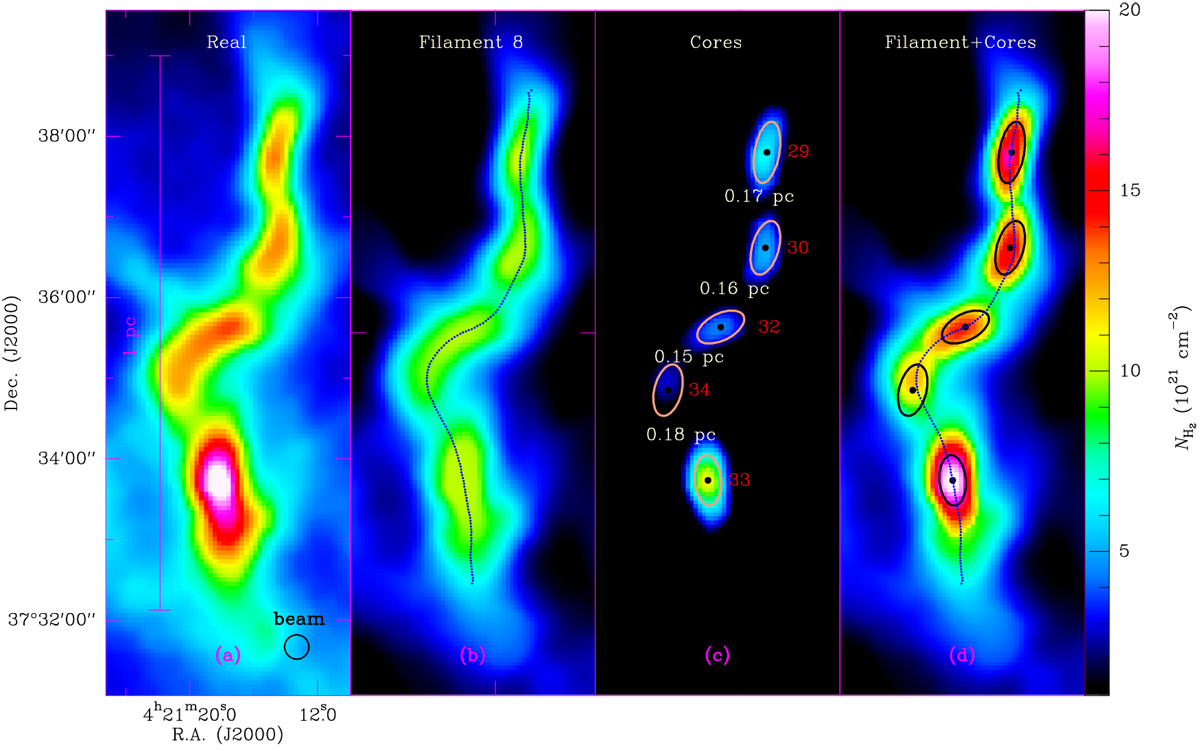
High-resolution (18.2″) column density views of filament 8 and its embedded cores. All maps are shown from 1021 to 2 × 1022 cm−2. Panel a: high-resolution (18.2″) column density map. Panel b: clean-background and core-subtracted filament image that was reconstructed over the full range of spatial scales. The crest of the filament is shown with a blue-dotted line. Panel c: five robust prestellar cores that were identified along this filament (marked by FWHM Gaussian ellipses), which are regularly spaced with measured projected spacings of 0.17, 0.16, 0.15, and 0.18 pc from south to north, respectively. The mean core spacing is 0.17 ± 0.01 pc. Panel d: detected cores overlaid on the filament.
Current usage metrics show cumulative count of Article Views (full-text article views including HTML views, PDF and ePub downloads, according to the available data) and Abstracts Views on Vision4Press platform.
Data correspond to usage on the plateform after 2015. The current usage metrics is available 48-96 hours after online publication and is updated daily on week days.
Initial download of the metrics may take a while.