Fig. 5
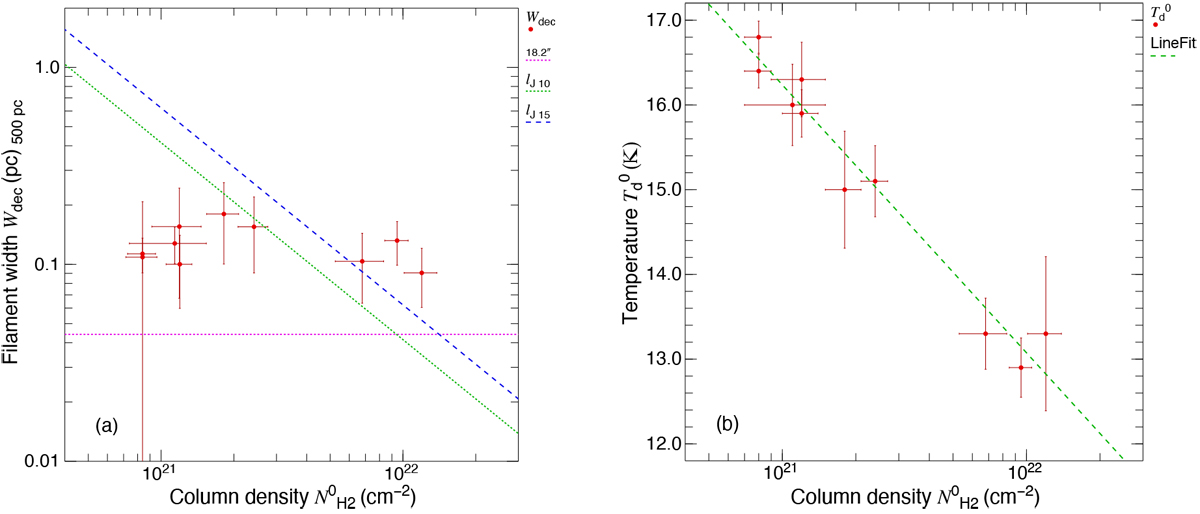
Deconvolved FWHM (Wdec) (panel a) and central dust temperature (![]() ) (panel b) against central H2
column density (
) (panel b) against central H2
column density (![]() ) for the ten selected filaments of Table 1. The error bars correspond to standard deviations. Panel a: thermal Jeans length
) for the ten selected filaments of Table 1. The error bars correspond to standard deviations. Panel a: thermal Jeans length ![]() as a function of column density is shown by green-dotted and blue-dashed lines for gas temperatures of 10 and 15 K, respectively, where
as a function of column density is shown by green-dotted and blue-dashed lines for gas temperatures of 10 and 15 K, respectively, where ![]() and W ~ 0.1 pc.
Panel b: a clear anti-correlation between
and W ~ 0.1 pc.
Panel b: a clear anti-correlation between ![]() and
and ![]() :
:
![]() (green-dashed line).
(green-dashed line).
Current usage metrics show cumulative count of Article Views (full-text article views including HTML views, PDF and ePub downloads, according to the available data) and Abstracts Views on Vision4Press platform.
Data correspond to usage on the plateform after 2015. The current usage metrics is available 48-96 hours after online publication and is updated daily on week days.
Initial download of the metrics may take a while.