Fig. 3
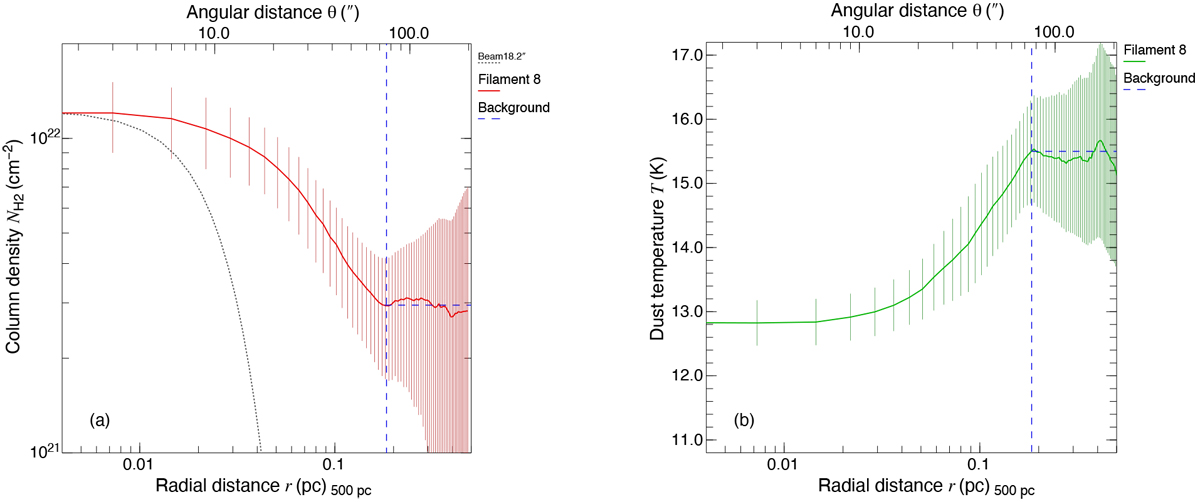
Median radial column density (a) and dust temperature (b) profiles of filament 8. Error bars correspond to the standard deviation of observed values at a given radius. Panel a: red solid line shows the median profile measured in the high-resolution (18.2″) column density map. The background level (at >0.18 pc, ~3 × 1021 cm−2) is marked with a blue-dashed line. The median FWHM of the filament derived from this column density profile is 0.14 ± 0.03 pc. Panel b: dust temperature, which was measured at the center of the filament, is ~ 13 K, comparedto ~15.5 K for the localbackground cloud at >0.18 pc, which is marked by a blue-dashed line.
Current usage metrics show cumulative count of Article Views (full-text article views including HTML views, PDF and ePub downloads, according to the available data) and Abstracts Views on Vision4Press platform.
Data correspond to usage on the plateform after 2015. The current usage metrics is available 48-96 hours after online publication and is updated daily on week days.
Initial download of the metrics may take a while.