Fig. 2
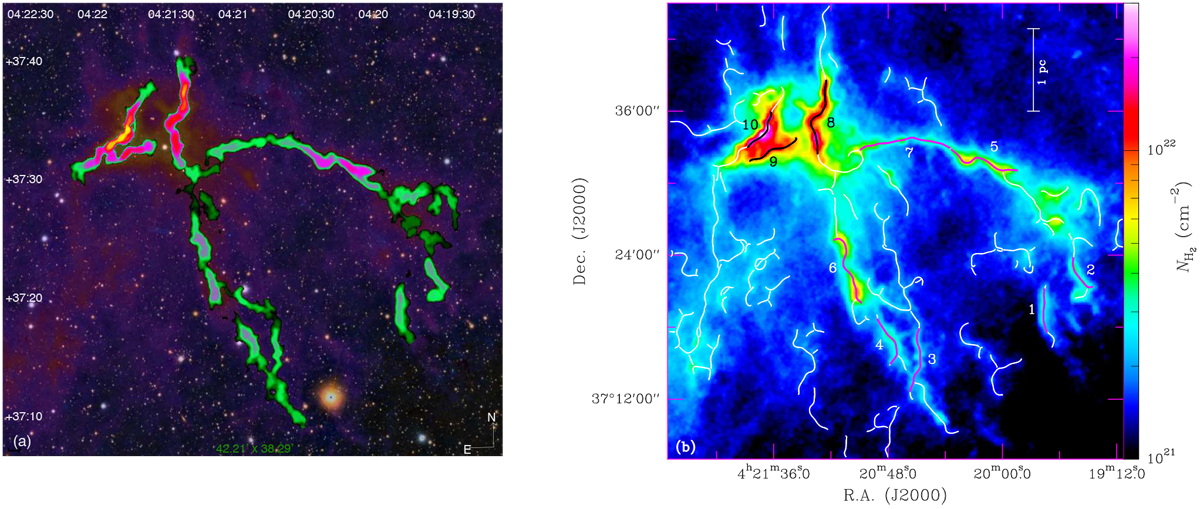
Blow-up column density views of the X-shaped nebula region in the California MC. Panel A: filtered version of the high-resolution (18.2″) column density map, showing partially-reconstructed filaments with transverse angular scales only up to ~ 100″ from getfilaments (cf. Sect. 2.4.3 in Men’shchikov 2013). The background image shows field stars from the Pan-STARRS optical survey (Chambers et al. 2016). Panel B: unfiltered high-resolution column density map with the network of filamentary structures identified by getfilaments overlaid in white. The crests of the ten filaments selected in Sect. 3.2 are highlighted in black and magenta for thermally supercritical filaments with Mline >Mline,crit and subcritical filaments with Mline < Mline,crit, respectively.
Current usage metrics show cumulative count of Article Views (full-text article views including HTML views, PDF and ePub downloads, according to the available data) and Abstracts Views on Vision4Press platform.
Data correspond to usage on the plateform after 2015. The current usage metrics is available 48-96 hours after online publication and is updated daily on week days.
Initial download of the metrics may take a while.