Fig. 10
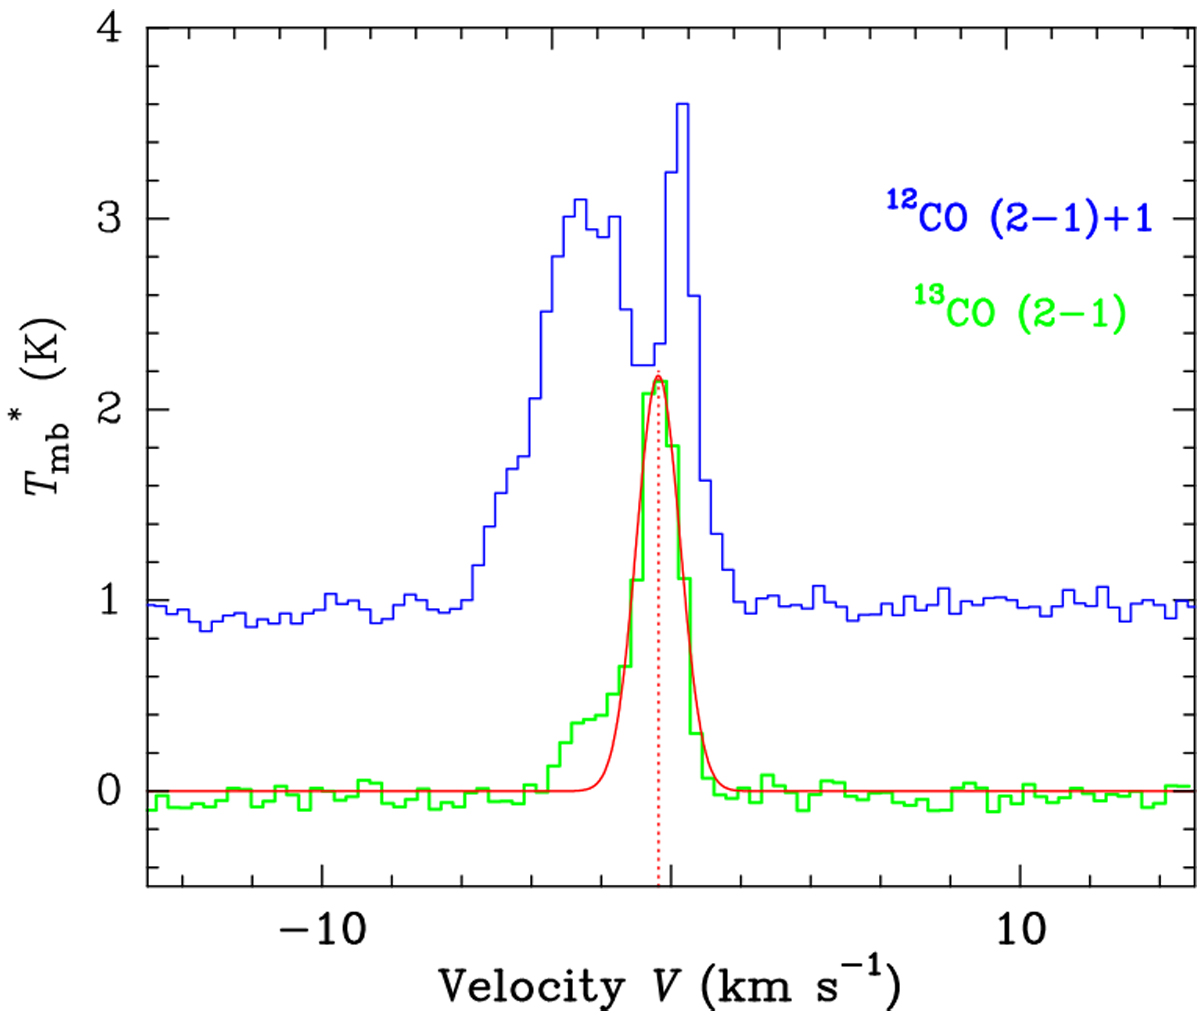
Mean 12CO(2–1) (blue) and 13CO(2–1) (green) spectra observed with the SMT along the crest of filament 8. A
+ 1 K offset was added to the corrected main beam temperature (![]() ) of the 12CO(2–1) spectrum. The red curve shows a Gaussian fit to the 13CO(2–1) line profile. The vertical red-dashed line marks the line centroid velocity of the
13 CO(2–1) spectrum (− 0.36 km s−1).
) of the 12CO(2–1) spectrum. The red curve shows a Gaussian fit to the 13CO(2–1) line profile. The vertical red-dashed line marks the line centroid velocity of the
13 CO(2–1) spectrum (− 0.36 km s−1).
Current usage metrics show cumulative count of Article Views (full-text article views including HTML views, PDF and ePub downloads, according to the available data) and Abstracts Views on Vision4Press platform.
Data correspond to usage on the plateform after 2015. The current usage metrics is available 48-96 hours after online publication and is updated daily on week days.
Initial download of the metrics may take a while.