Fig. 9.
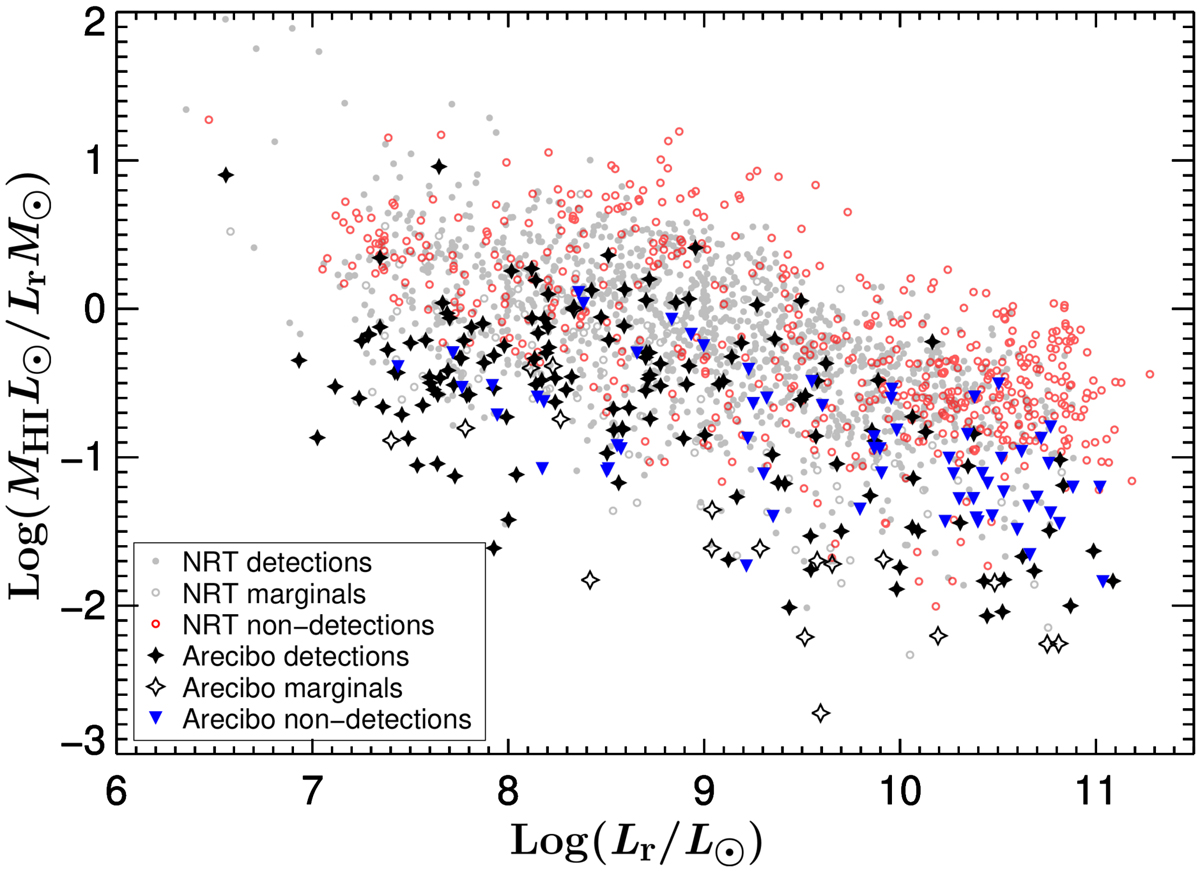
Log![]() , as a function of log(Lr/L⊙) for the Arecibo and Nançay samples within the Arecibo sample’s declination range. Excluded are sources that were clearly confused or had unreliable photometry. Nançay detections, marginals, and nondetections are represented by gray dots, open gray circles, and open red circles respectively. Arecibo detections, marginals, and nondetections are respectively represented by black solid stars, open stars, and blue downward triangles.
, as a function of log(Lr/L⊙) for the Arecibo and Nançay samples within the Arecibo sample’s declination range. Excluded are sources that were clearly confused or had unreliable photometry. Nançay detections, marginals, and nondetections are represented by gray dots, open gray circles, and open red circles respectively. Arecibo detections, marginals, and nondetections are respectively represented by black solid stars, open stars, and blue downward triangles.
Current usage metrics show cumulative count of Article Views (full-text article views including HTML views, PDF and ePub downloads, according to the available data) and Abstracts Views on Vision4Press platform.
Data correspond to usage on the plateform after 2015. The current usage metrics is available 48-96 hours after online publication and is updated daily on week days.
Initial download of the metrics may take a while.