Fig. 6.
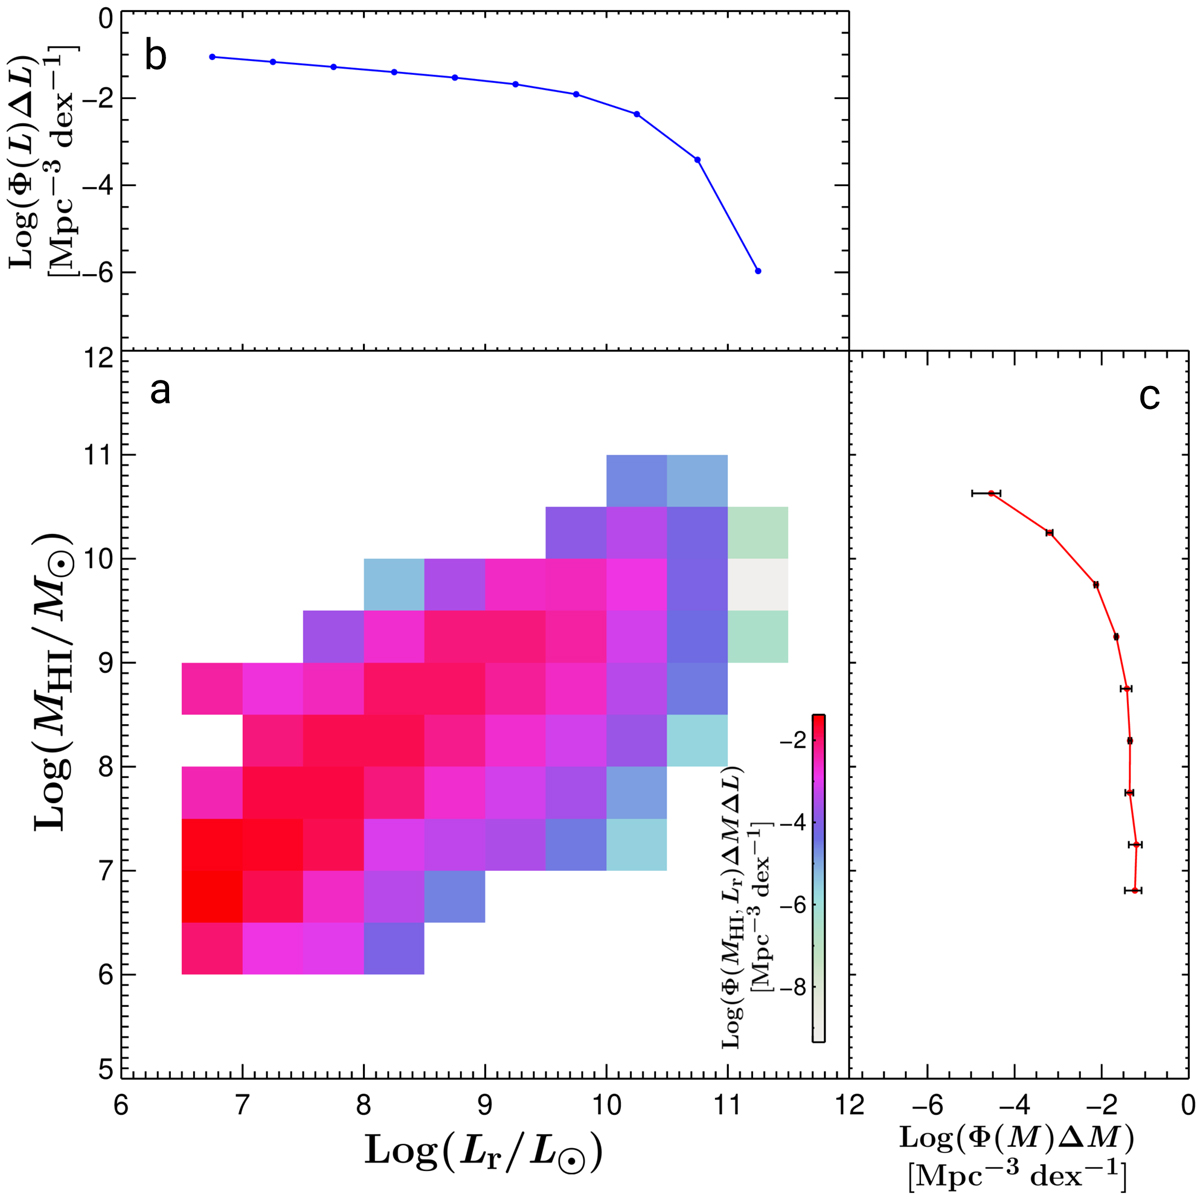
Main panel a: two-dimensional bivariate Lr–H I mass distribution of the NIBLES sample galaxies, derived from a combination of the Nançay and Arecibo sample distributions. The values represented by the colorbar (see the legend) are the volume densities in each 0.5 dex wide bin in both luminosity and H I mass, log(Φ(MHI,Lr)ΔMΔL) in units of Mpc−3 dex−1, as a function of both H I mass and r-band luminosity Lr (in solar units). Upper panel b: summation of the main panel over H I mass, which reproduces the input Luminosity Function from Montero-Dorta & Prada (2009), log(Φ(L)ΔL) in units of Mpc−3 dex−1. Right panel c: summation of the bivariate distribution over luminosity, that is, the H I Mass Function, log(Φ(M)ΔM) in units of Mpc−3 dex−1. See the text for further details on the log(MHI/M⊙) = 6.25 and 10.75 bins in the HIMF.
Current usage metrics show cumulative count of Article Views (full-text article views including HTML views, PDF and ePub downloads, according to the available data) and Abstracts Views on Vision4Press platform.
Data correspond to usage on the plateform after 2015. The current usage metrics is available 48-96 hours after online publication and is updated daily on week days.
Initial download of the metrics may take a while.