Fig. A.1.
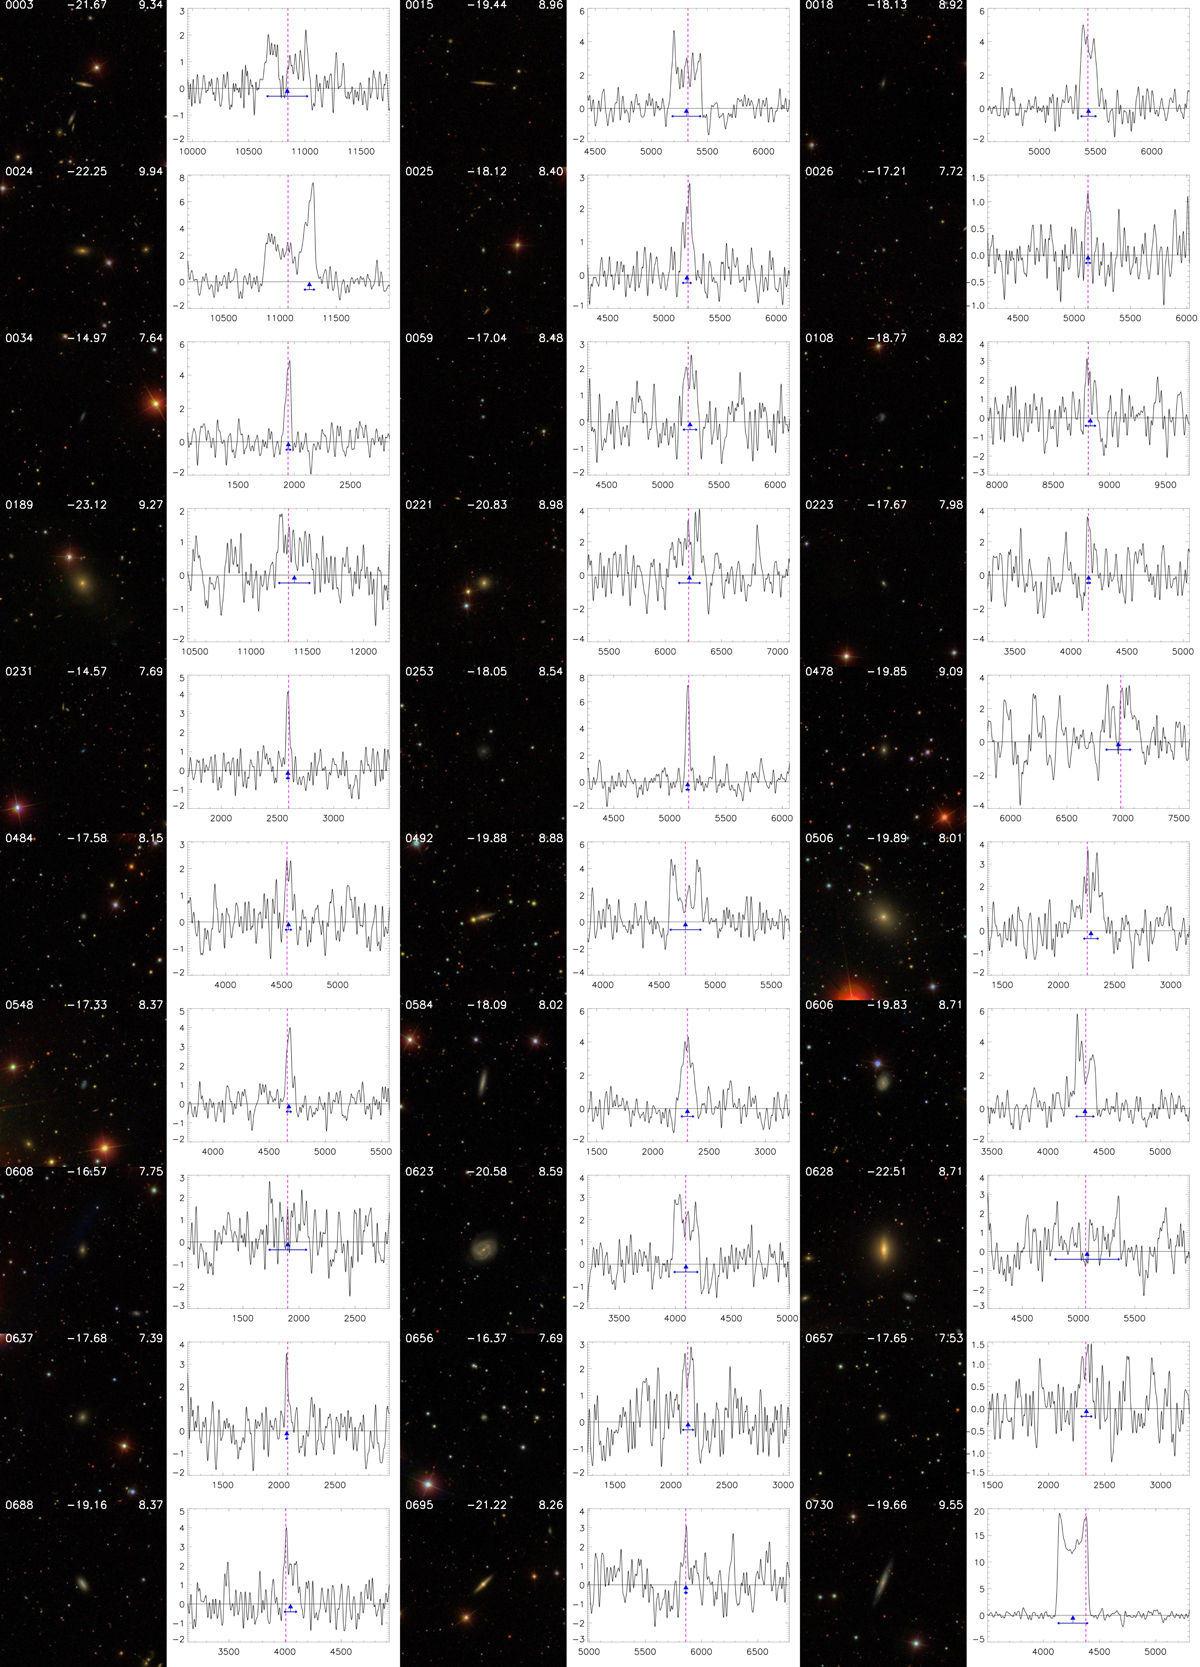
Color (g, r and i band composite) images from the SDSS alongside 21 cm H I line spectra of galaxies clearly detected at Arecibo. The size of each image is 2′ × 2′ with the NIBLES source number indicated in the upper left corner, absolute z-band magnitude, Mz, in the top center and log(MHI/M⊙) in the top right corner of each image. The vertical axis in the spectra is flux density in mJy, the horizontal axis is heliocentric recession velocity (cz) in km s−1. The SDSS recession velocity is denoted by a vertical dashed magenta line, the mean H I velocity by the blue triangle, and the W50 line width by the horizontal blue arrow bar. Velocity resolution is 18.7 km s−1. Confused galaxies are denoted by a C in the upper right portion of the spectrum. See Paper II for codes used in the previous campaigns.
Current usage metrics show cumulative count of Article Views (full-text article views including HTML views, PDF and ePub downloads, according to the available data) and Abstracts Views on Vision4Press platform.
Data correspond to usage on the plateform after 2015. The current usage metrics is available 48-96 hours after online publication and is updated daily on week days.
Initial download of the metrics may take a while.