Fig. 12.
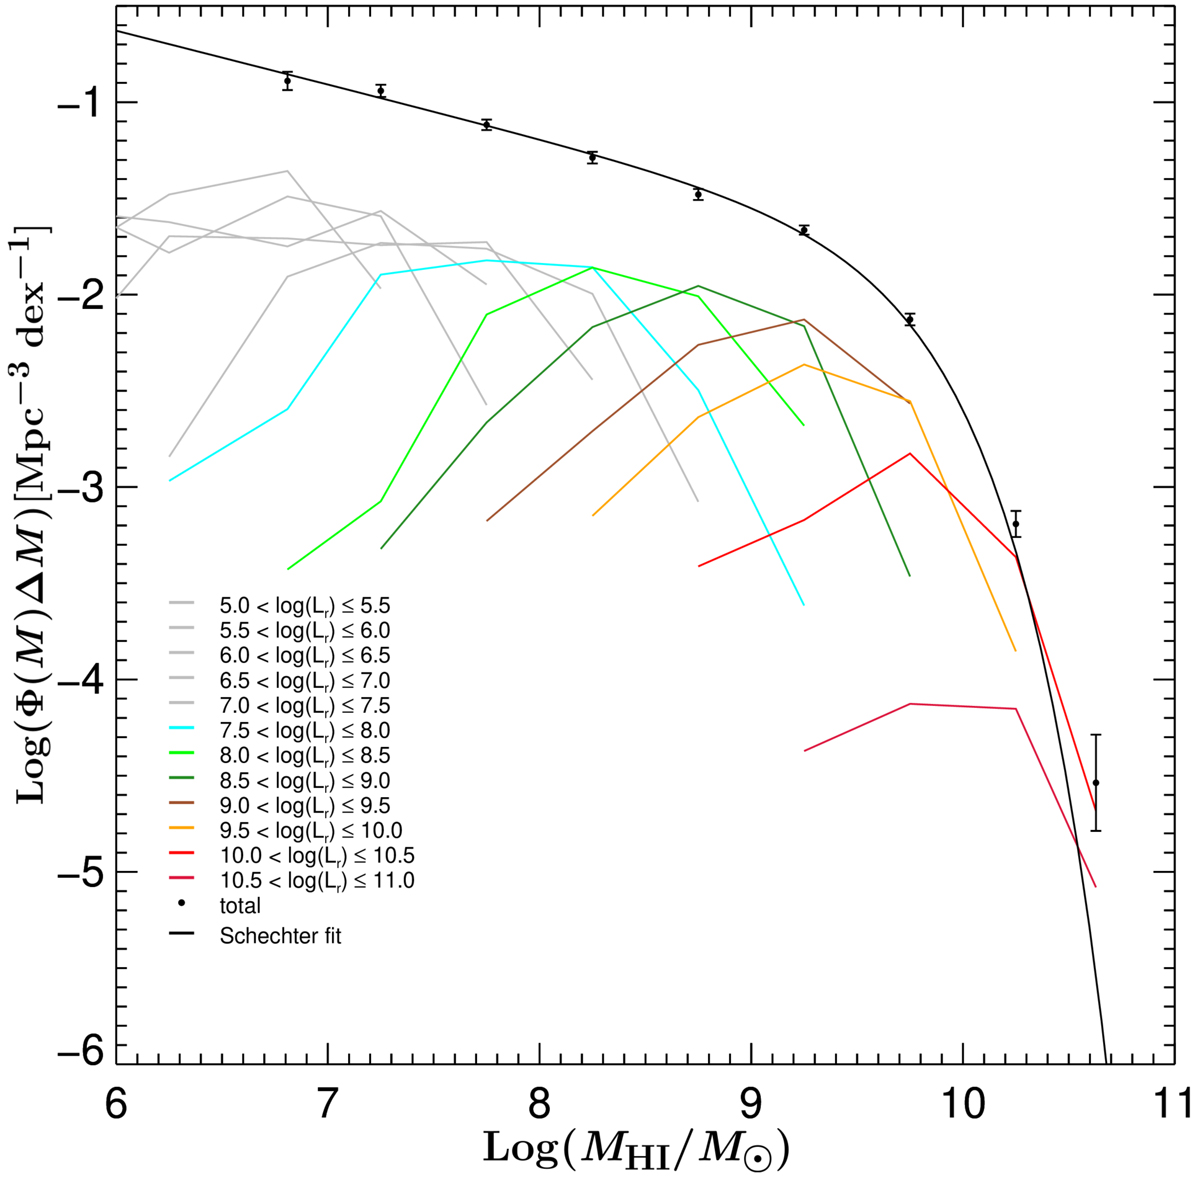
Reconstructed H I Mass Function based on the combined optically corrected Nançay and Arecibo distributions (data points and the Schechter function fit to them, in black), and contributions to the HIMF for individual luminosity bins, indicated by different colors (see the Legend). Volume densities are shown in each 0.5 dex wide bin in H I mass, log(Φ(M)ΔM), in units of Mpc−3 dex−1. We recreated a plot similar to Fig. 7 with artificial, extrapolated H I mass distributions for luminosity bins below log(Lr/L⊙) = 7.75 shown in gray. For viewing clarity we omit points with uncertainties larger than the density values and do not show the uncertainty regions on each luminosity bin. Uncertainties for the corrected bins are given in Table 2.
Current usage metrics show cumulative count of Article Views (full-text article views including HTML views, PDF and ePub downloads, according to the available data) and Abstracts Views on Vision4Press platform.
Data correspond to usage on the plateform after 2015. The current usage metrics is available 48-96 hours after online publication and is updated daily on week days.
Initial download of the metrics may take a while.