Free Access
Fig. 13.
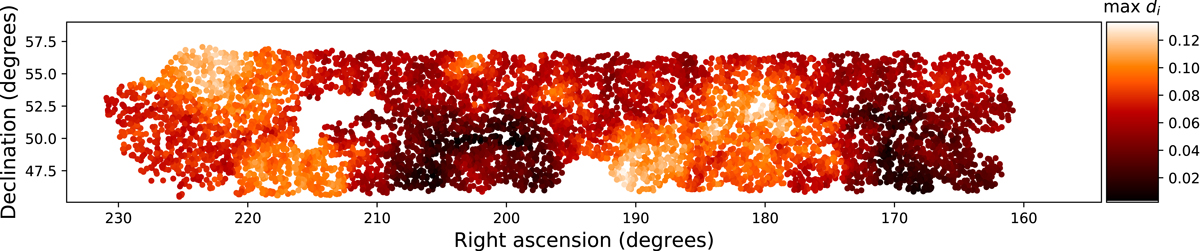
Scatter plot of the maximum dispersion measure (Eq. (13)) for every source, which indicates the strength of an alignment signal, of the selected sample of 7555 radio sources plotted for n = 700 as a function of right ascension and declination.
Current usage metrics show cumulative count of Article Views (full-text article views including HTML views, PDF and ePub downloads, according to the available data) and Abstracts Views on Vision4Press platform.
Data correspond to usage on the plateform after 2015. The current usage metrics is available 48-96 hours after online publication and is updated daily on week days.
Initial download of the metrics may take a while.