Fig. 8.
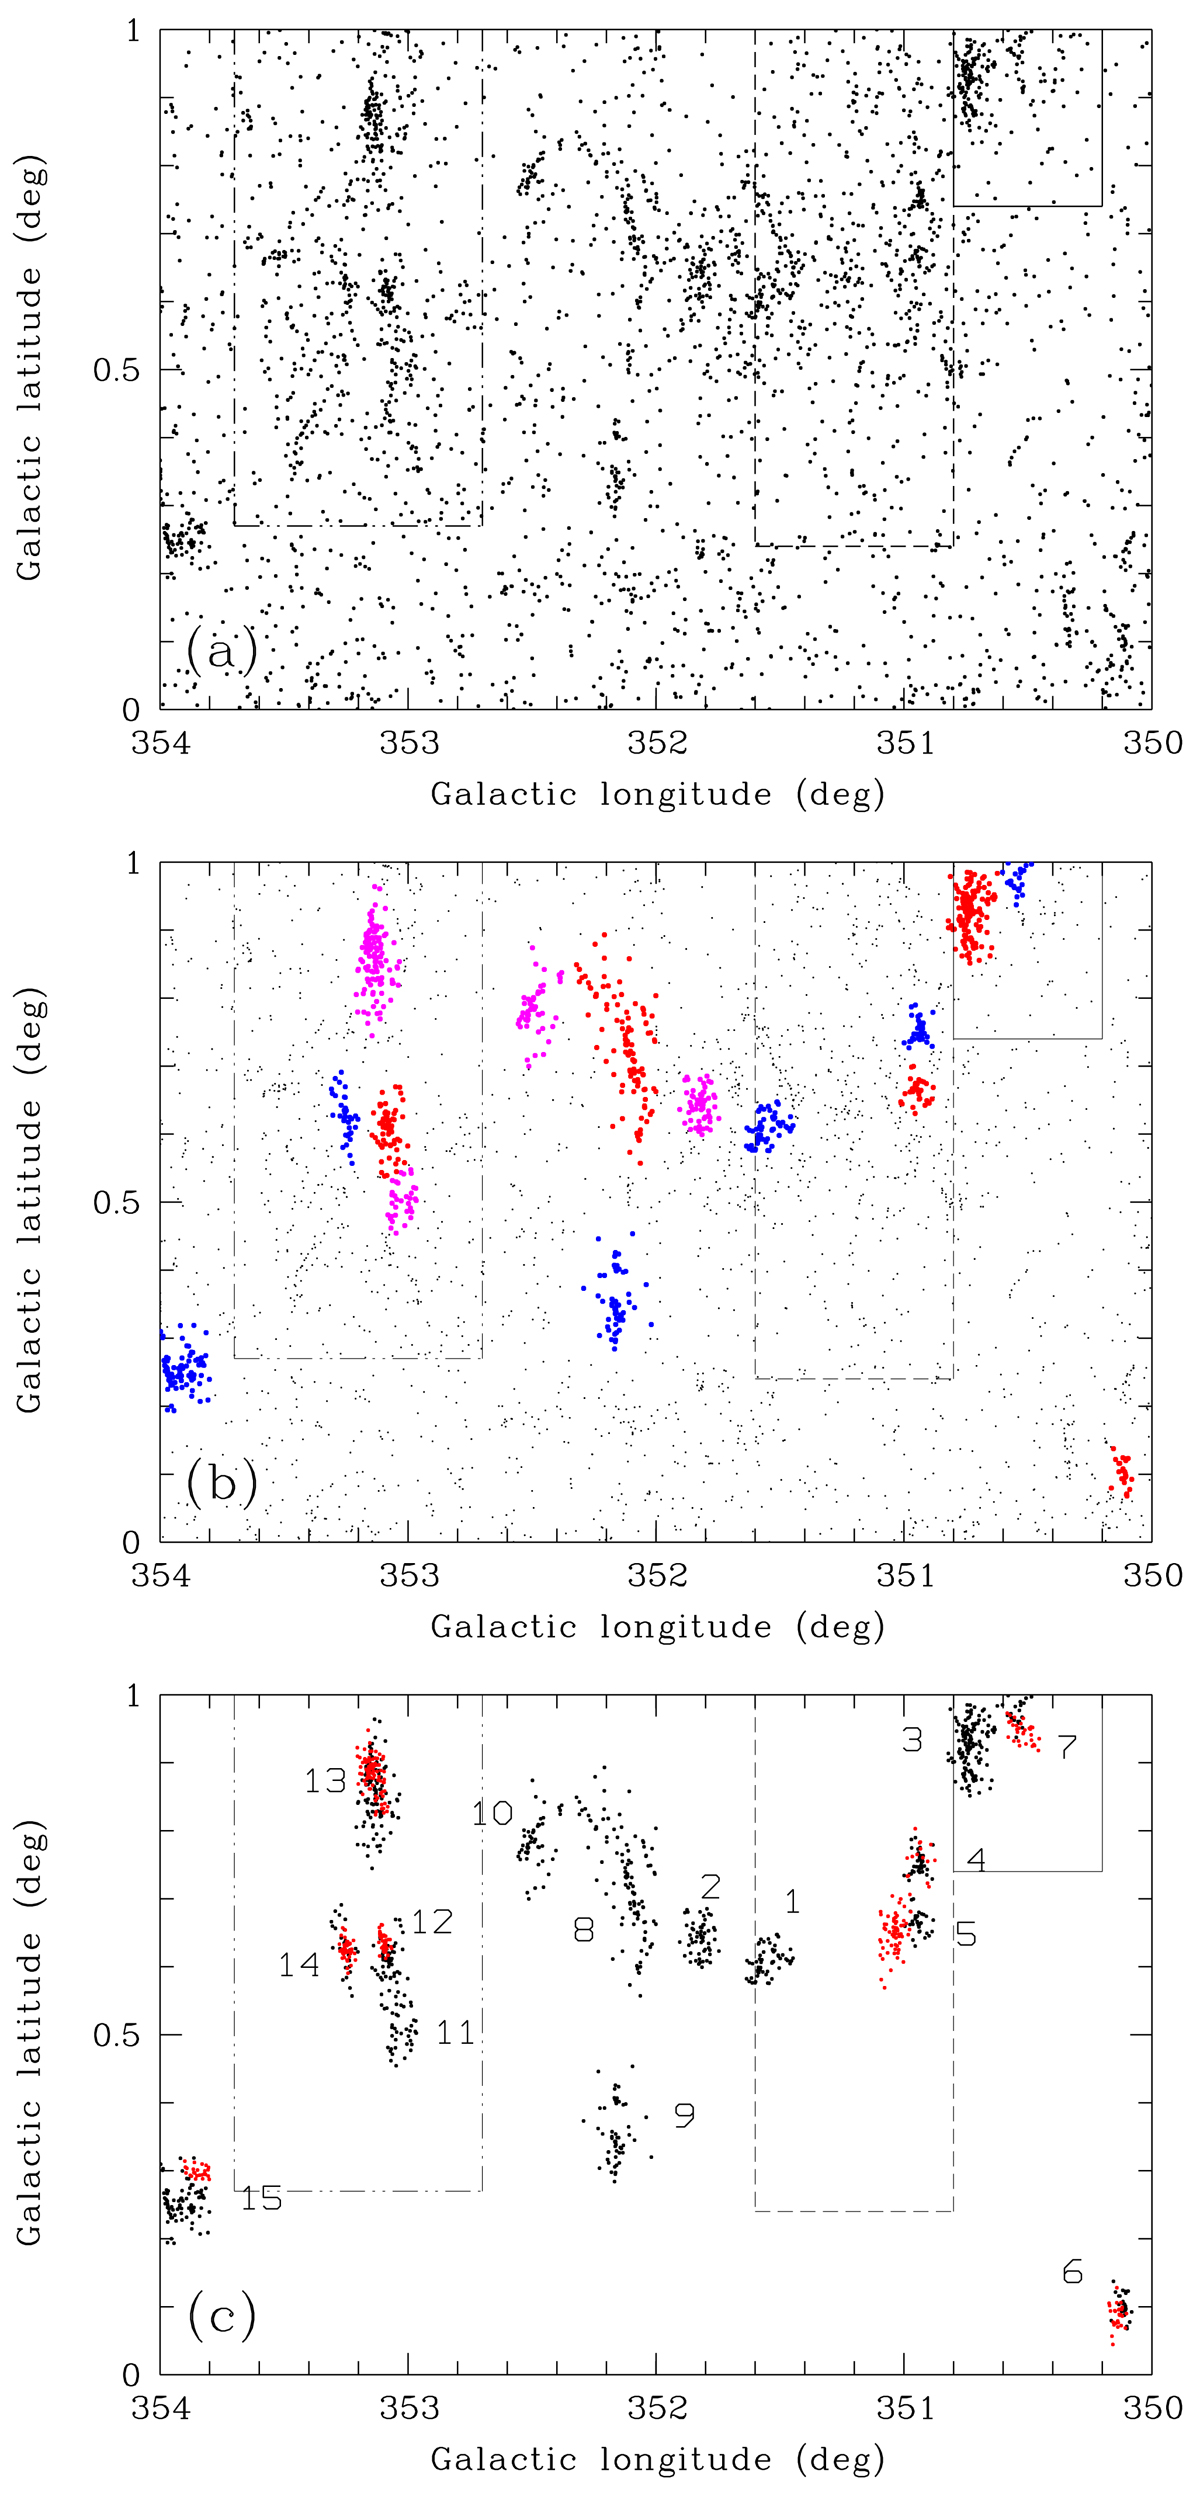
YSO distribution and cluster identification. Figures are: (a) the YSO spatial distribution (black dots), (b) the 2D YSO clustering identification (colored dots), and (c) the clustered stars from Gaia information (in red) overplotted on the 2D YSO groups (black dots). Each group is labeled as in Table 4. NGC 6357 (dashed double dotted line), NGC 6334 (short dashed line), and GM1-24 (solid line) regions are delineated on every panel.
Current usage metrics show cumulative count of Article Views (full-text article views including HTML views, PDF and ePub downloads, according to the available data) and Abstracts Views on Vision4Press platform.
Data correspond to usage on the plateform after 2015. The current usage metrics is available 48-96 hours after online publication and is updated daily on week days.
Initial download of the metrics may take a while.