Open Access
Fig. 6.
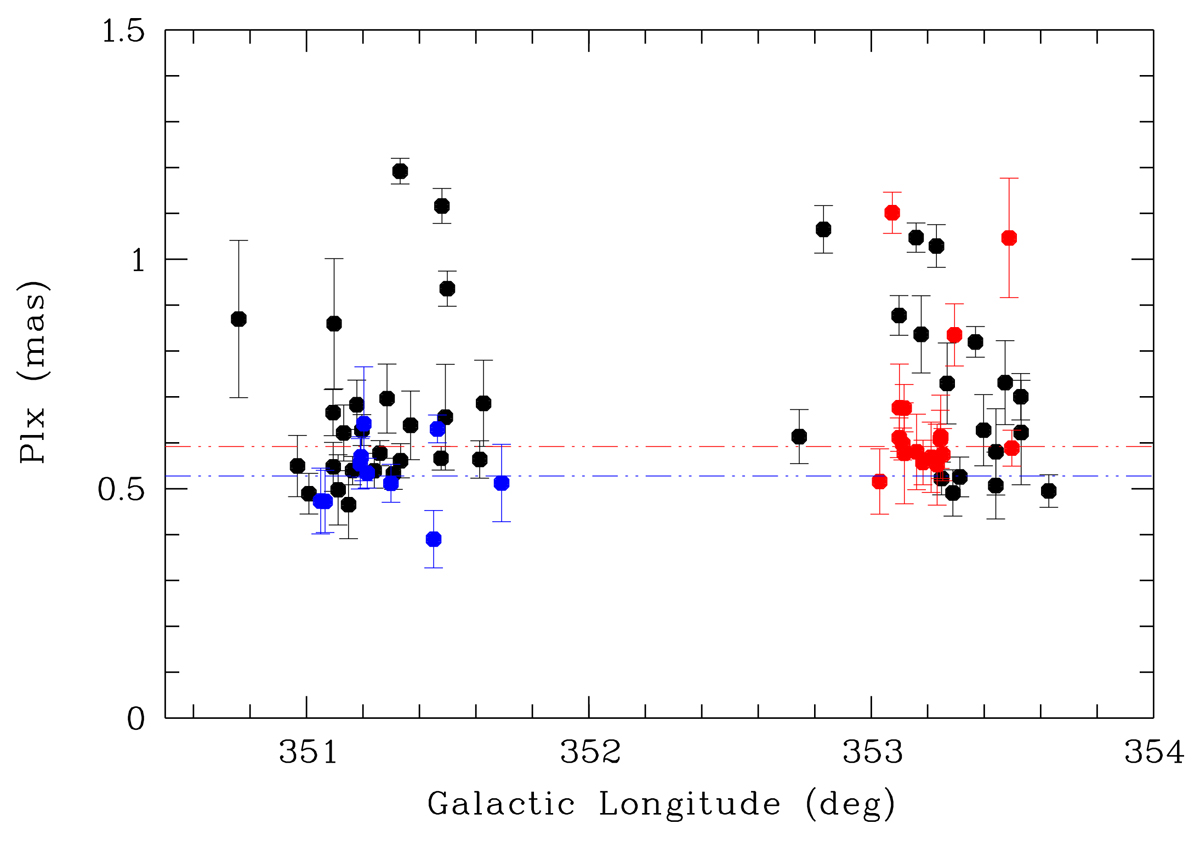
Parallax versus longitude plot of YSOs from Povich et al. (2013). The color coding is the same as in Fig. 3. The blue and red lines display the mean parallaxes for NGC 6334 and NGC 6357, respectively (excluding outliers). Black symbols are sources classified as non-members by Povich et al. (2013).
Current usage metrics show cumulative count of Article Views (full-text article views including HTML views, PDF and ePub downloads, according to the available data) and Abstracts Views on Vision4Press platform.
Data correspond to usage on the plateform after 2015. The current usage metrics is available 48-96 hours after online publication and is updated daily on week days.
Initial download of the metrics may take a while.