Fig. 2.
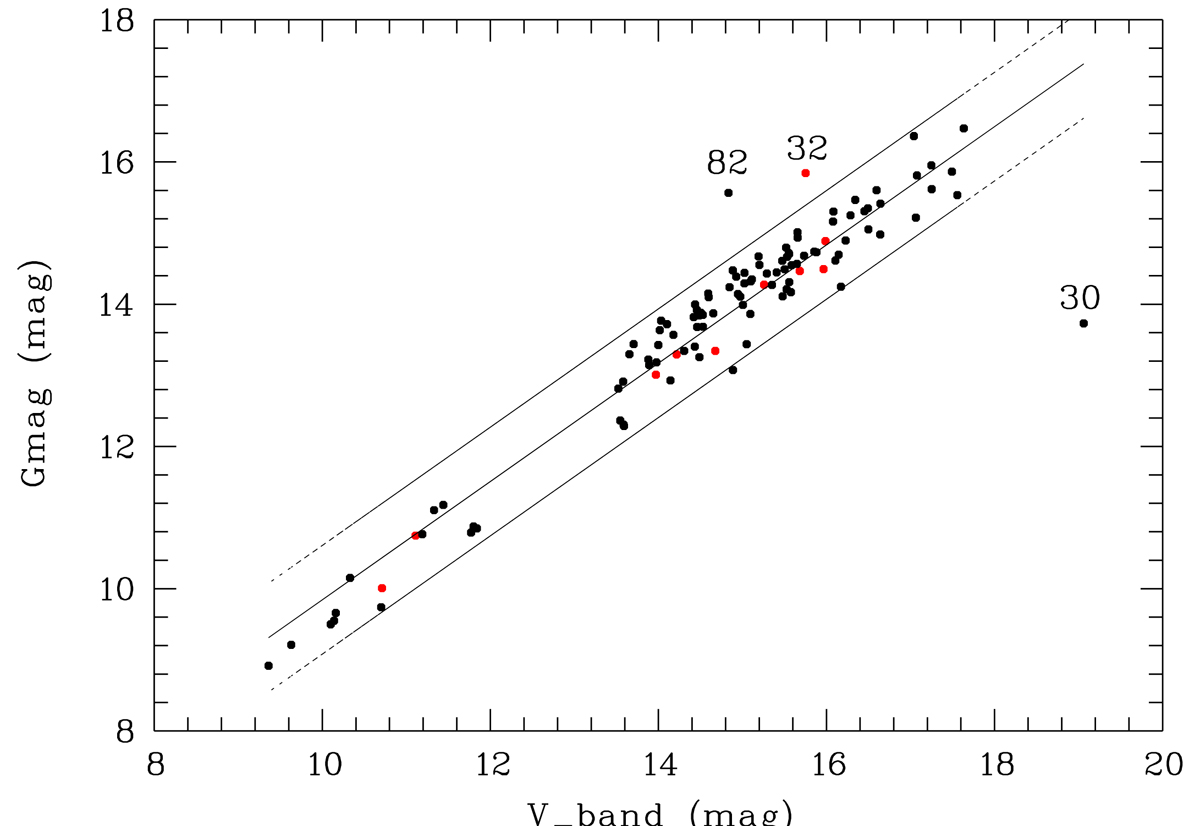
Gaia-G versus V-band magnitude. The linear regression fit (central line) gives the relation G = 0.831(±0.026) × V + 1.528(±0.382). The two lines on both sides of the linear regression fit delineate the 2σ band. Black (red) symbols indicate OB stars filling (not filling) the full selection criteria (π > 0, RUWE ≤ 1.4, and σπ/π ≤ 0.2).
Current usage metrics show cumulative count of Article Views (full-text article views including HTML views, PDF and ePub downloads, according to the available data) and Abstracts Views on Vision4Press platform.
Data correspond to usage on the plateform after 2015. The current usage metrics is available 48-96 hours after online publication and is updated daily on week days.
Initial download of the metrics may take a while.