Fig. 14.
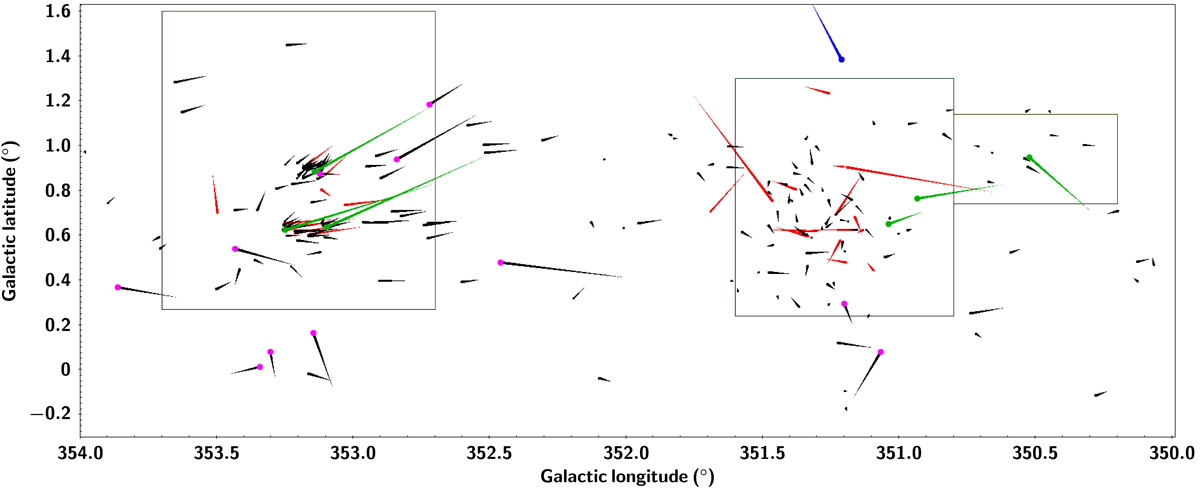
Velocity vectors plots. Velocity vectors of OB stars (runaway OB star candidates are indicated by magenta dots) and YSOs are displayed as black and red arrows, respectively. Velocity vectors of YSO groups are displayed in green, while the Bochum 13 cluster (Cantat-Gaudin & Anders 2020) vector is displayed in blue. For clarity, taking the velocity vector length for Bochum 13 (4.79 km s−1) as reference, the YSO and OB star vectors have been ploted with a relative scale of 0.33 and 0.11, respectively. Only stars and groups with 0.48 ≤ πle0.67 are shown. The squares delineate the regions: NGC 6357 (l ∼ 353.2°), NGC 6334 (l ∼ 351.2°), and GM1-24 (l ∼ 350.5°).
Current usage metrics show cumulative count of Article Views (full-text article views including HTML views, PDF and ePub downloads, according to the available data) and Abstracts Views on Vision4Press platform.
Data correspond to usage on the plateform after 2015. The current usage metrics is available 48-96 hours after online publication and is updated daily on week days.
Initial download of the metrics may take a while.