Fig. 3.
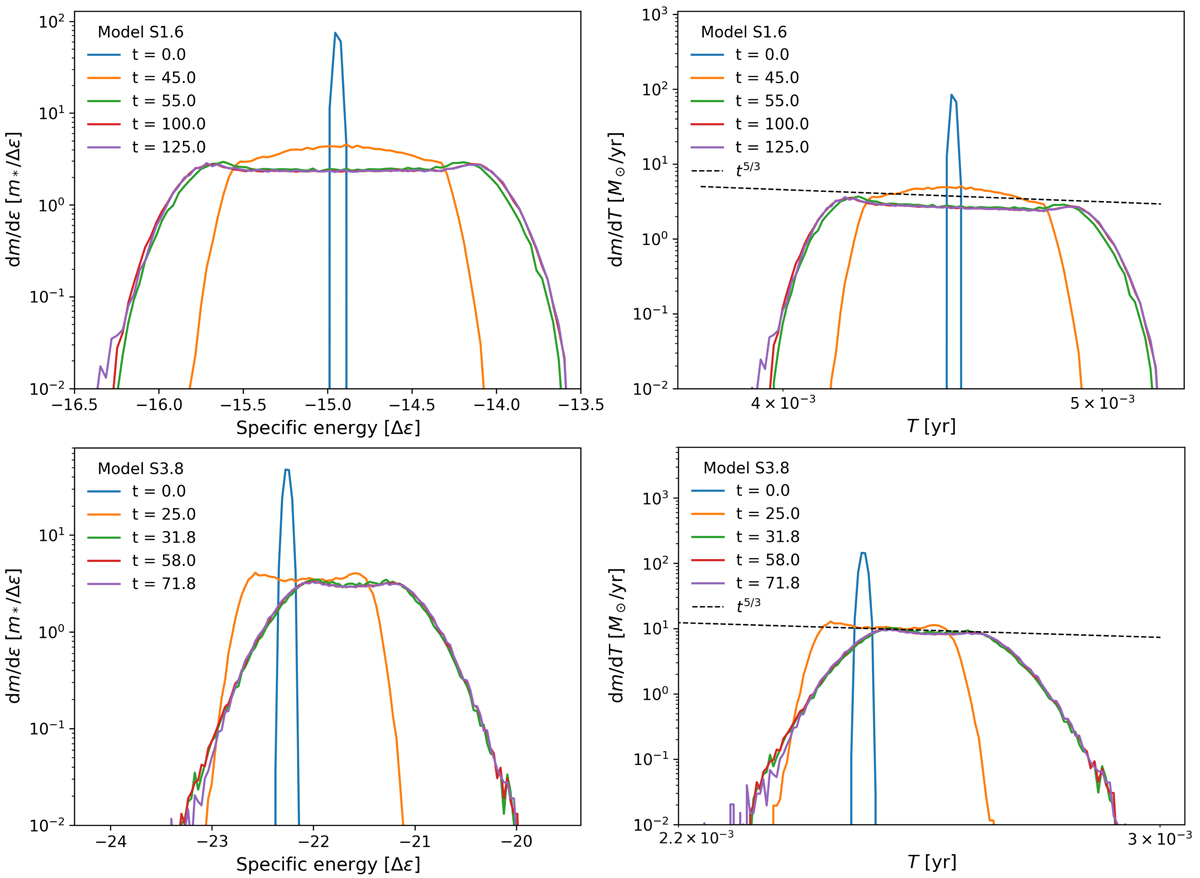
Specific energy distribution (left) and corresponding fallback mass rates (right) of models S1.6 (top) and S3.8 (bottom). The colours correspond to different times of the simulation: blue is at the star’s initial position at ra, orange is at the first passage to rp, green is during the formation of the two debris tails, red is during the stretching and falling back of the most bound debris tail, and purple is at the second passage to rp.
Current usage metrics show cumulative count of Article Views (full-text article views including HTML views, PDF and ePub downloads, according to the available data) and Abstracts Views on Vision4Press platform.
Data correspond to usage on the plateform after 2015. The current usage metrics is available 48-96 hours after online publication and is updated daily on week days.
Initial download of the metrics may take a while.