Free Access
Fig. 11.
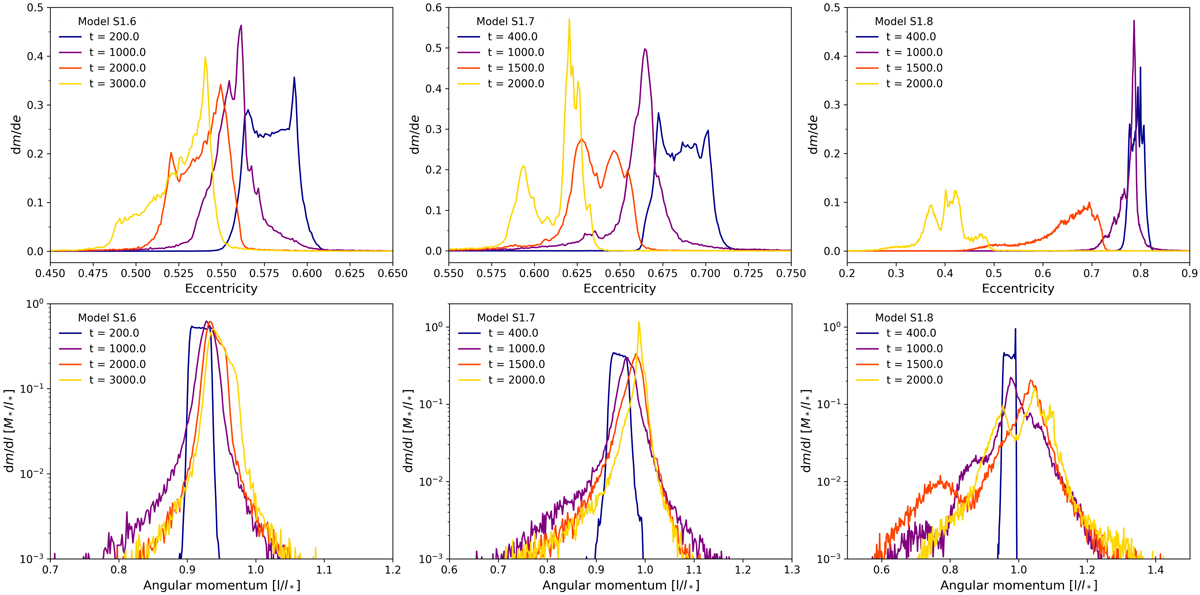
Eccentricity distributions (top row) and angular momentum distributions (bottom row) for models S1.6, S1.7, and S1.8. For each plot the evolution of the corresponding distribution is shown for different times t (at t = 0 the star is at ra).
Current usage metrics show cumulative count of Article Views (full-text article views including HTML views, PDF and ePub downloads, according to the available data) and Abstracts Views on Vision4Press platform.
Data correspond to usage on the plateform after 2015. The current usage metrics is available 48-96 hours after online publication and is updated daily on week days.
Initial download of the metrics may take a while.