Fig. 3
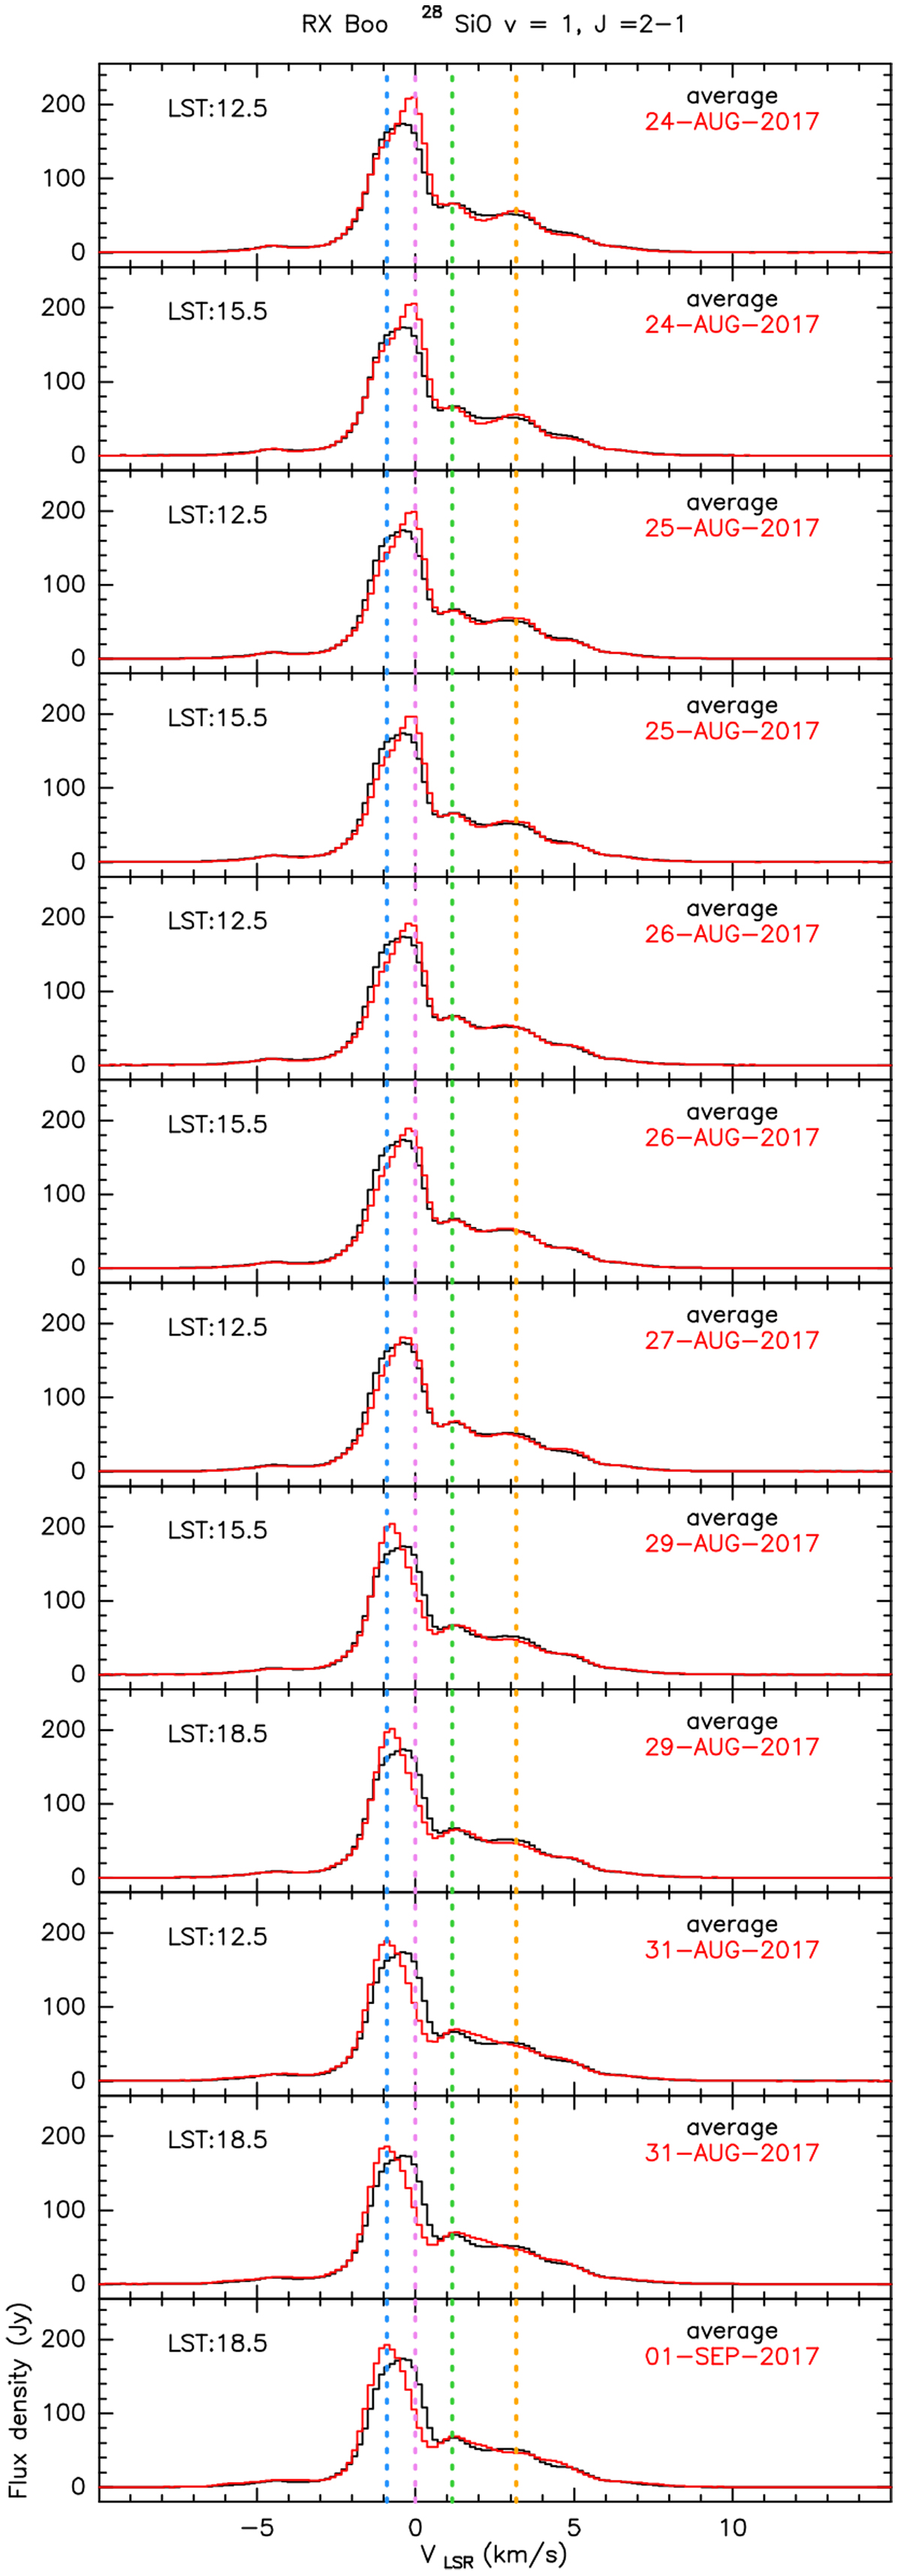
Time evolution of the 28SiO v = 1 J = 2–1 line observed in RX Boo during our August–September 2017 observing run. The average spectra are plotted in black and the individual spectra (one per local sidereal time and day) are plotted in red. The dashed vertical lines indicate the spectral components for which our statistical analysis is performed.
Current usage metrics show cumulative count of Article Views (full-text article views including HTML views, PDF and ePub downloads, according to the available data) and Abstracts Views on Vision4Press platform.
Data correspond to usage on the plateform after 2015. The current usage metrics is available 48-96 hours after online publication and is updated daily on week days.
Initial download of the metrics may take a while.