Free Access
Fig. A.2
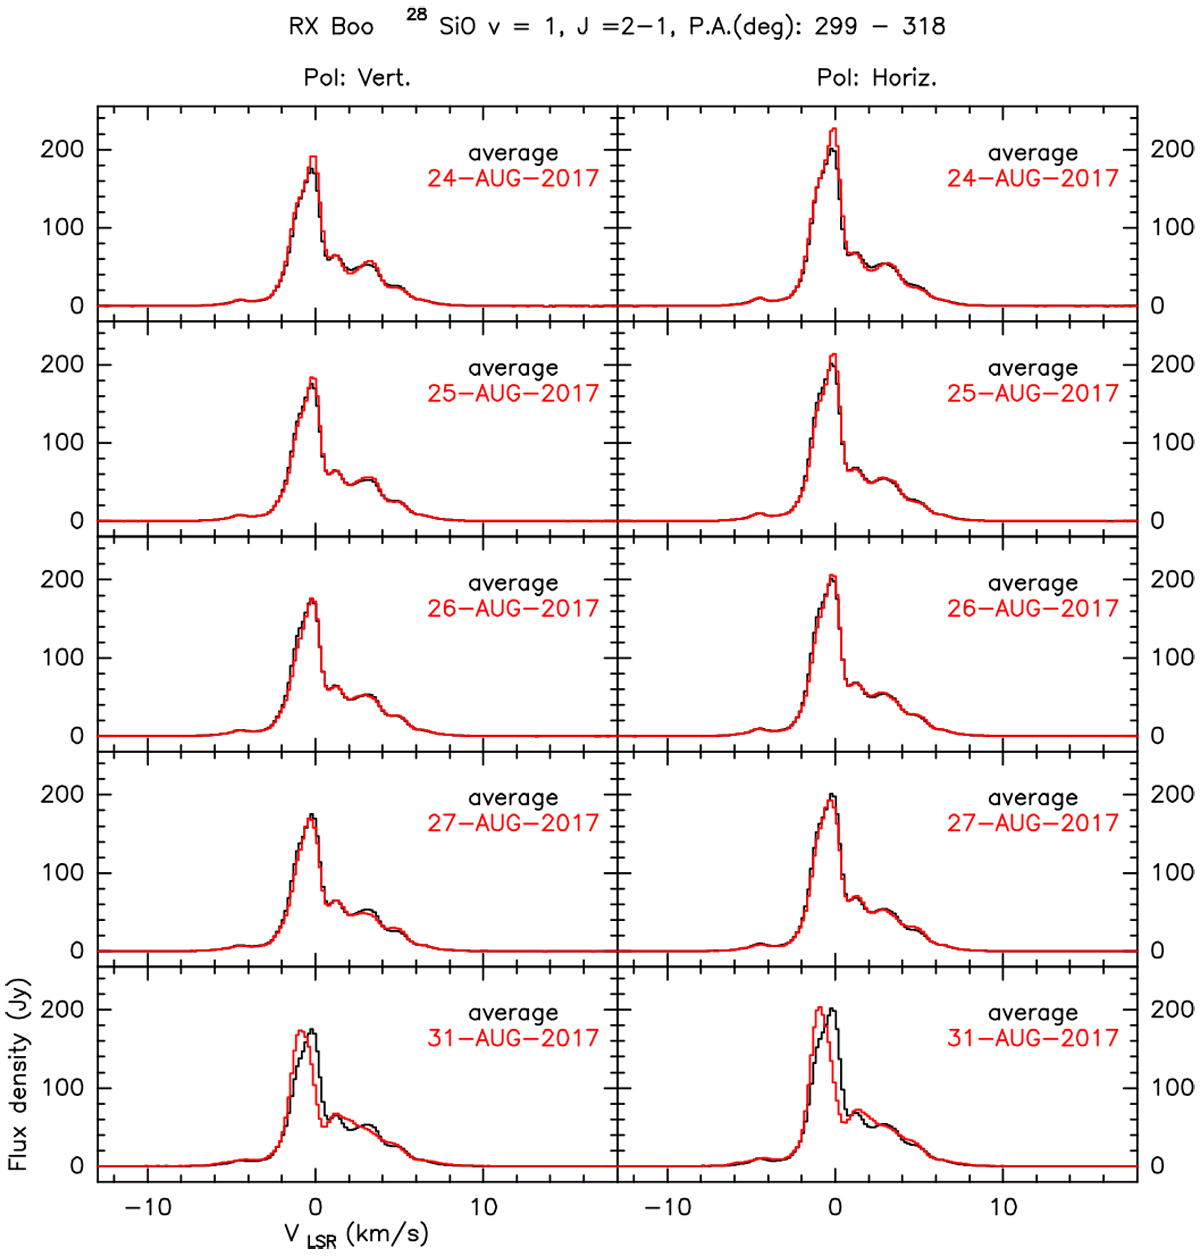
Time evolution of the vertical (left) and horizontal (right) linear polarization of the 28SiO v = 1 J = 2–1 line observed in RX Boo during our August 2016 observing run in a LST range between 299 and 318 degrees. We compare theaverage spectrum of each polarization (black) with the individual spectra (red).
Current usage metrics show cumulative count of Article Views (full-text article views including HTML views, PDF and ePub downloads, according to the available data) and Abstracts Views on Vision4Press platform.
Data correspond to usage on the plateform after 2015. The current usage metrics is available 48-96 hours after online publication and is updated daily on week days.
Initial download of the metrics may take a while.