Fig. 2
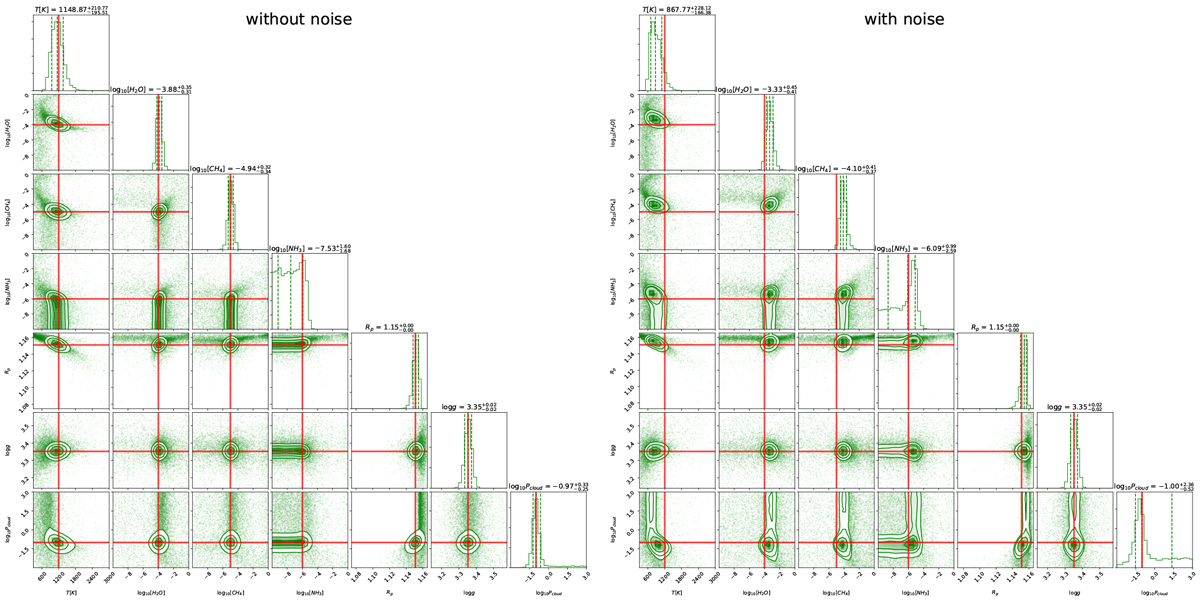
Results from the retrieval validation tests. Left panel: posterior distributions when the retrieval is performed on the mock data without applying Gaussian noise to the simulated observations, right panels: posterior distributions when Gaussian noise is applied to the simulated observations. Red lines indicate the input values in the forward model. The green contour lines display the 1, 2, and 3σ uncertainties.
Current usage metrics show cumulative count of Article Views (full-text article views including HTML views, PDF and ePub downloads, according to the available data) and Abstracts Views on Vision4Press platform.
Data correspond to usage on the plateform after 2015. The current usage metrics is available 48-96 hours after online publication and is updated daily on week days.
Initial download of the metrics may take a while.