Free Access
Fig. A.1
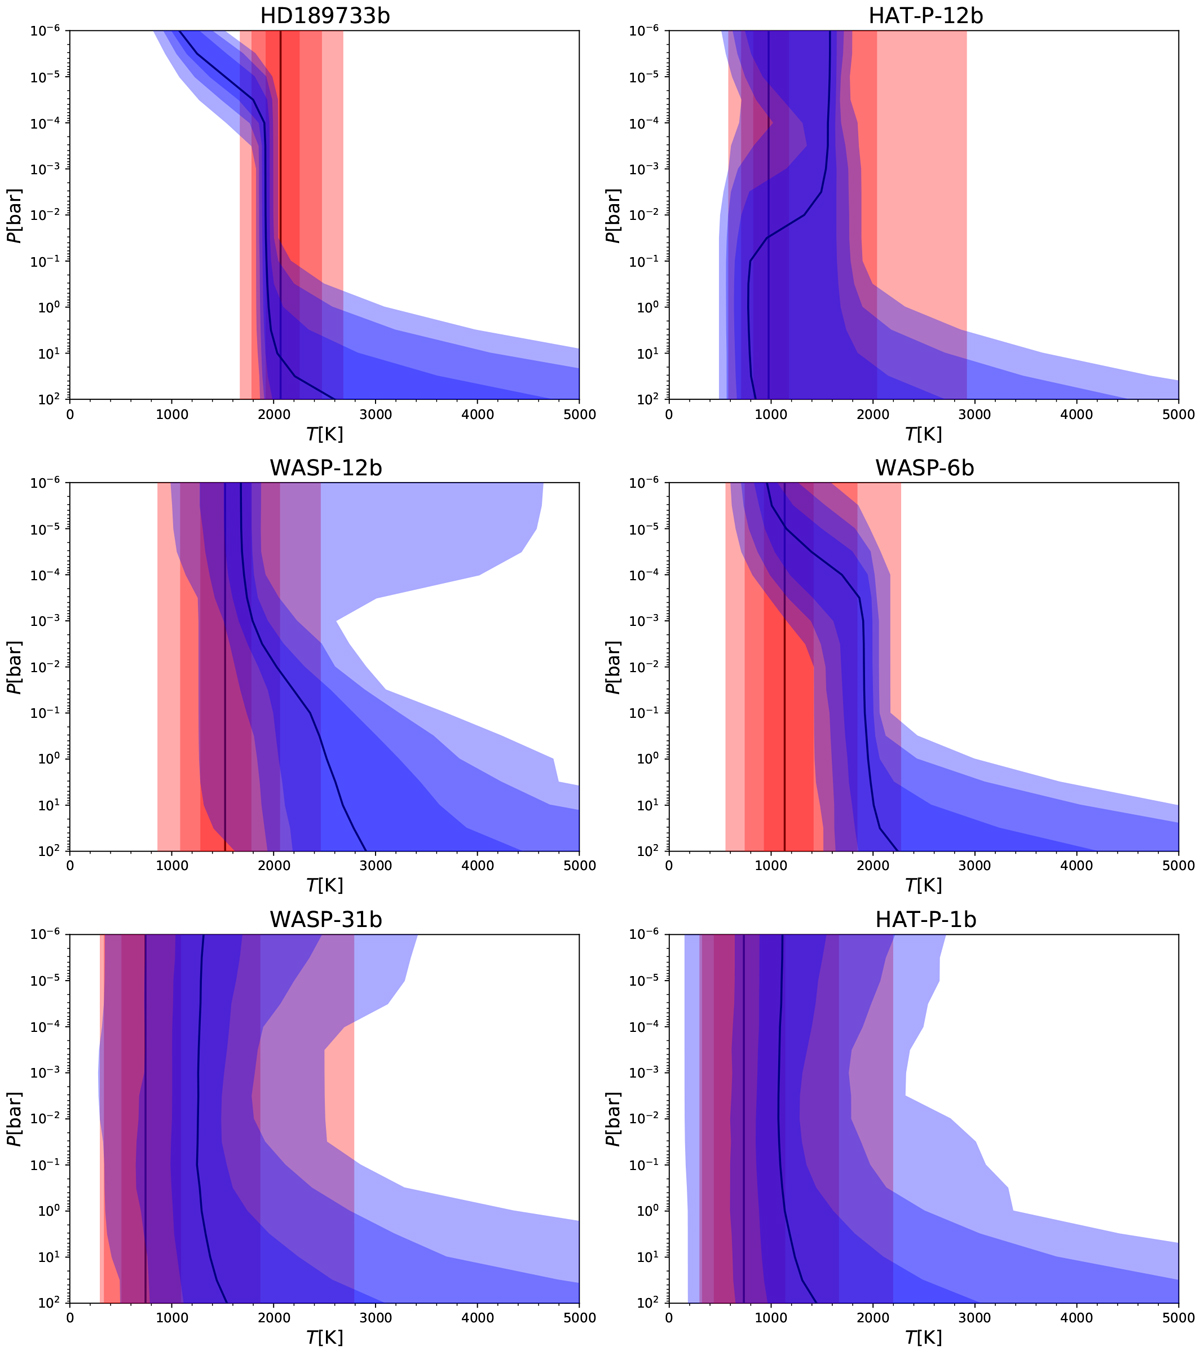
Pressure temperature structures for all ten planets considered. The blue area indicates the 1-, 2-, and 3-sigma limits from the model constrained retrieval, while the red areas indicate the structure for the classic retrieval.
Current usage metrics show cumulative count of Article Views (full-text article views including HTML views, PDF and ePub downloads, according to the available data) and Abstracts Views on Vision4Press platform.
Data correspond to usage on the plateform after 2015. The current usage metrics is available 48-96 hours after online publication and is updated daily on week days.
Initial download of the metrics may take a while.