Fig. 9.
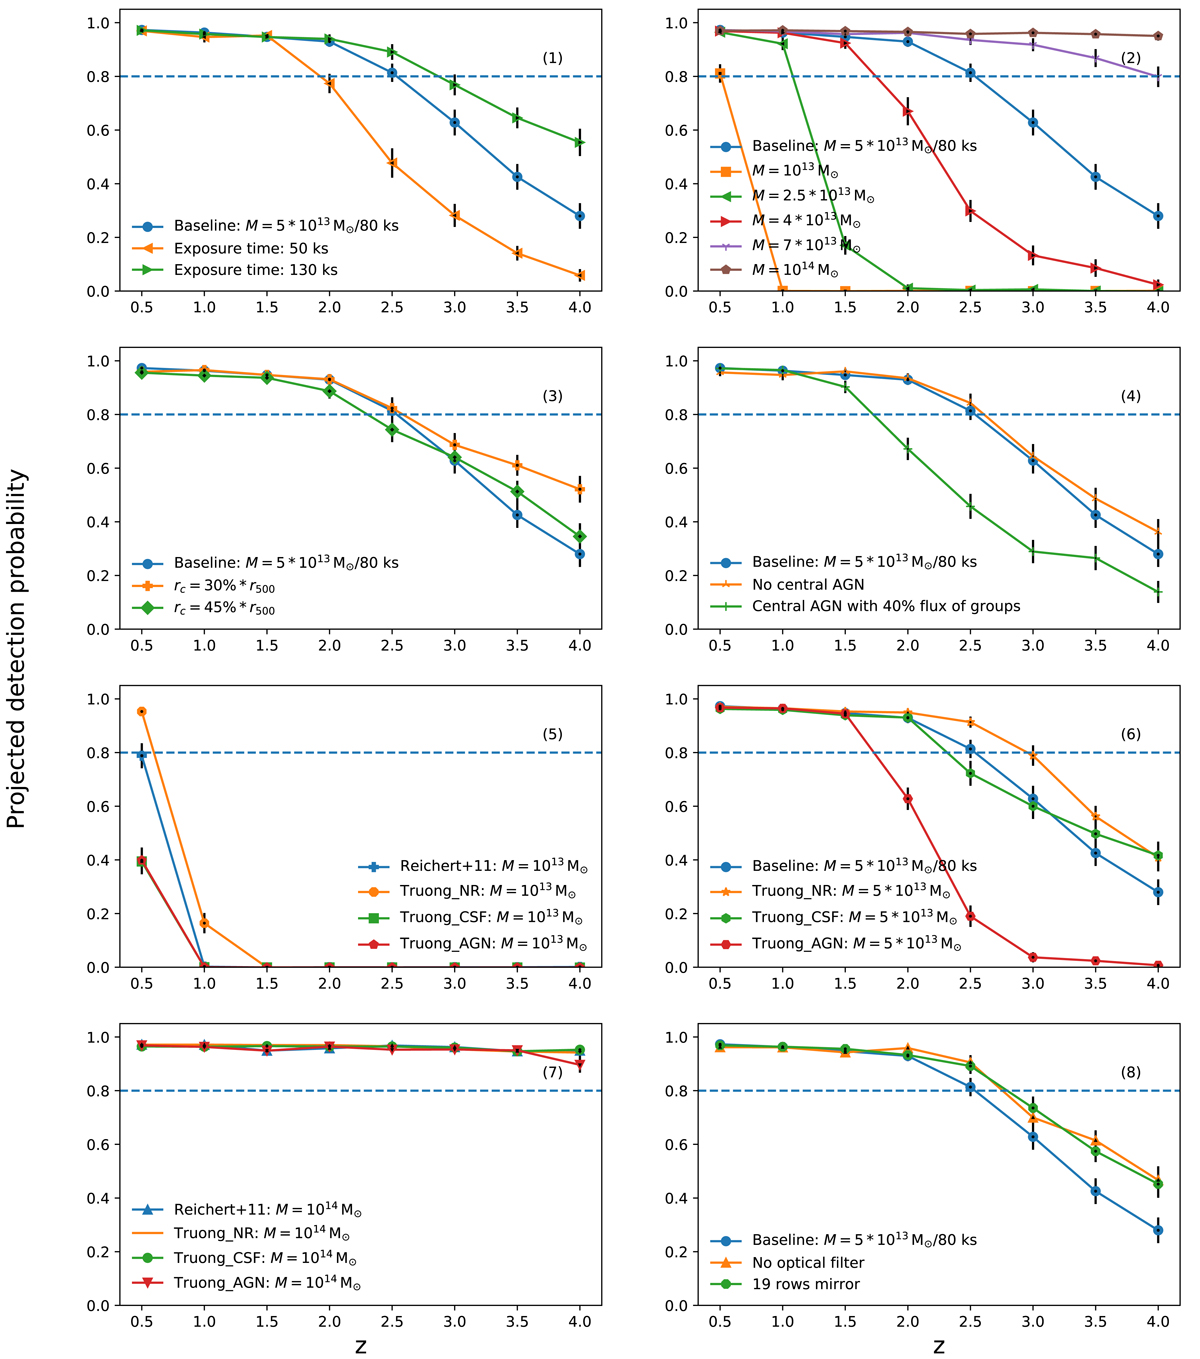
Projected detection probability averaged over the ATHENA FoV, which is a weighted probability from on-axis to the edge of the detector as described in Sect. 3.2.3. The dashed blue horizontal line represents the projected detection probability at 0.8. Panel 1: baseline model with exposure times of 50 ks, 80 ks, and 130 ks. Panel 2: baseline model for different masses. Panel 3: assuming different surface brightness profile: rc = 30%×r500 and rc = 45%×r500. Panel 4: assuming there is no AGN in the center of galaxy groups, and assuming 40% flux of the groups to the central AGN. Panel 5: modified scaling relations of mass 1013 M⊙. Panel 6: modified scaling relations of mass 5 × 10¹³ M⊙. Panel 7: modified scaling relations of mass 1014 M⊙. Panel 8: different ATHENA configurations used: without applying optical filter and with 19 mirror rows. The modified scaling relations are based on Reichert et al. (2011) and Truong et al. (2018).
Current usage metrics show cumulative count of Article Views (full-text article views including HTML views, PDF and ePub downloads, according to the available data) and Abstracts Views on Vision4Press platform.
Data correspond to usage on the plateform after 2015. The current usage metrics is available 48-96 hours after online publication and is updated daily on week days.
Initial download of the metrics may take a while.