Fig. 6.
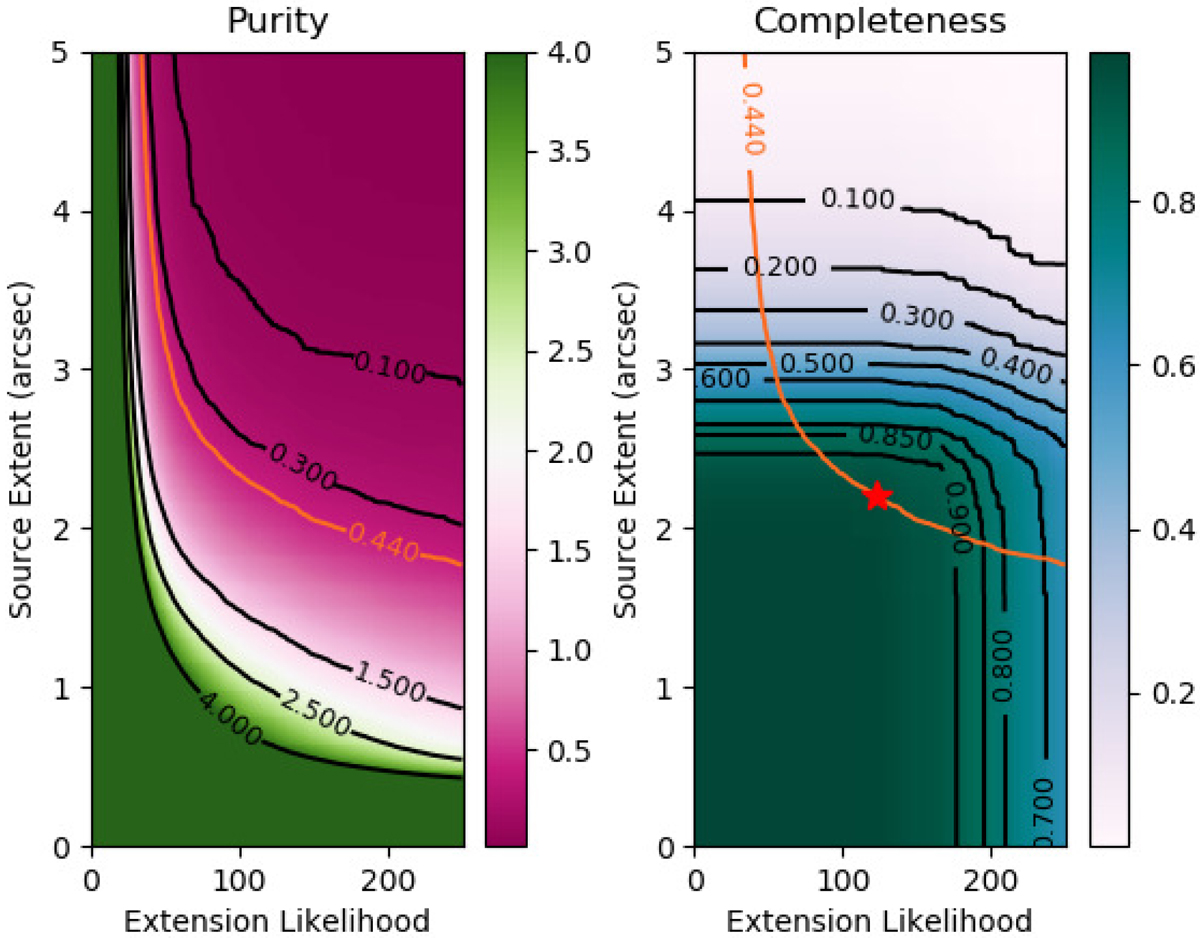
Purity and completeness contours to identify the optimal location of extent−extension-likelihood plane for the baseline 80 ks simulation. Left: black purity contour lines are used to identify the source contamination levels, the orange line represents a 0.44 sources per image contamination rate, which corresponds to one source per deg2 false detection rate. Right: completeness contour is then used to find the location to maximize the detection probability of galaxy groups. The orange line is the same as in the left panel, and the orange star represents the selection criteria to distinguish between point-like and extended sources, at ∼93% completeness level.
Current usage metrics show cumulative count of Article Views (full-text article views including HTML views, PDF and ePub downloads, according to the available data) and Abstracts Views on Vision4Press platform.
Data correspond to usage on the plateform after 2015. The current usage metrics is available 48-96 hours after online publication and is updated daily on week days.
Initial download of the metrics may take a while.