Fig. 5.
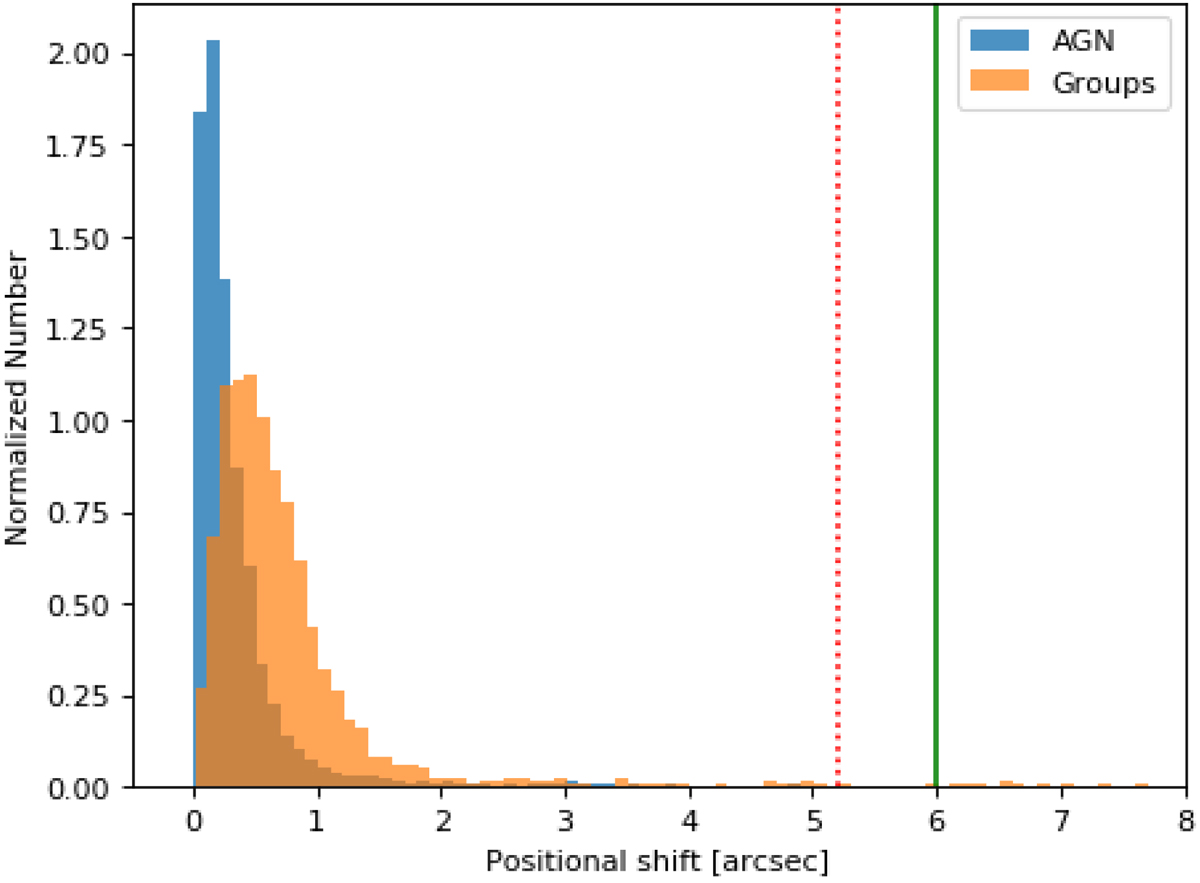
Positional accuracy on AGN (blue) and galaxy groups (orange). The position shift is defined as the distance between the input positions of the simulated sources and the positions of their corresponding closest detected sources. The red vertical dotted line indicates the ATHENA FOV-averaged PSF 5.2″, and the green solid line at 6.0″ is the adopted cross-matching radius for the detected sources.
Current usage metrics show cumulative count of Article Views (full-text article views including HTML views, PDF and ePub downloads, according to the available data) and Abstracts Views on Vision4Press platform.
Data correspond to usage on the plateform after 2015. The current usage metrics is available 48-96 hours after online publication and is updated daily on week days.
Initial download of the metrics may take a while.