Fig. 3.
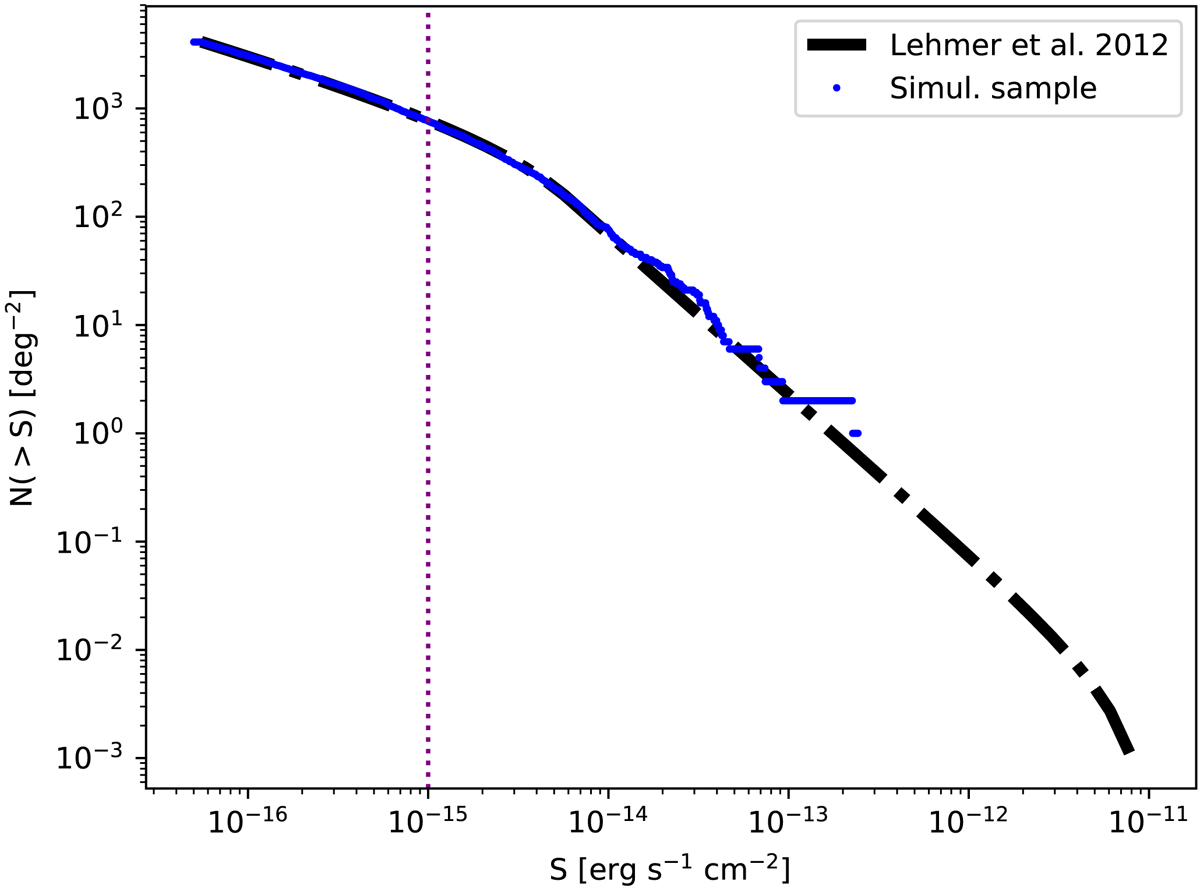
Cumulative number counts vs. flux for the AGNs in the 0.5 − 2.0 keV energy band. The black curve is from Lehmer et al. (2012); the blue dotted curve represents one realization of an AGN population used for the simulation. The purple dotted line indicates the AGN flux cut (≥1 × 10⁻¹⁵ ergs s−1 cm2) for the 90% encircled energy fraction when removing the AGN contamination at the stage of the spectral fitting (Sect. 3.2.5).
Current usage metrics show cumulative count of Article Views (full-text article views including HTML views, PDF and ePub downloads, according to the available data) and Abstracts Views on Vision4Press platform.
Data correspond to usage on the plateform after 2015. The current usage metrics is available 48-96 hours after online publication and is updated daily on week days.
Initial download of the metrics may take a while.