Fig. A.1.
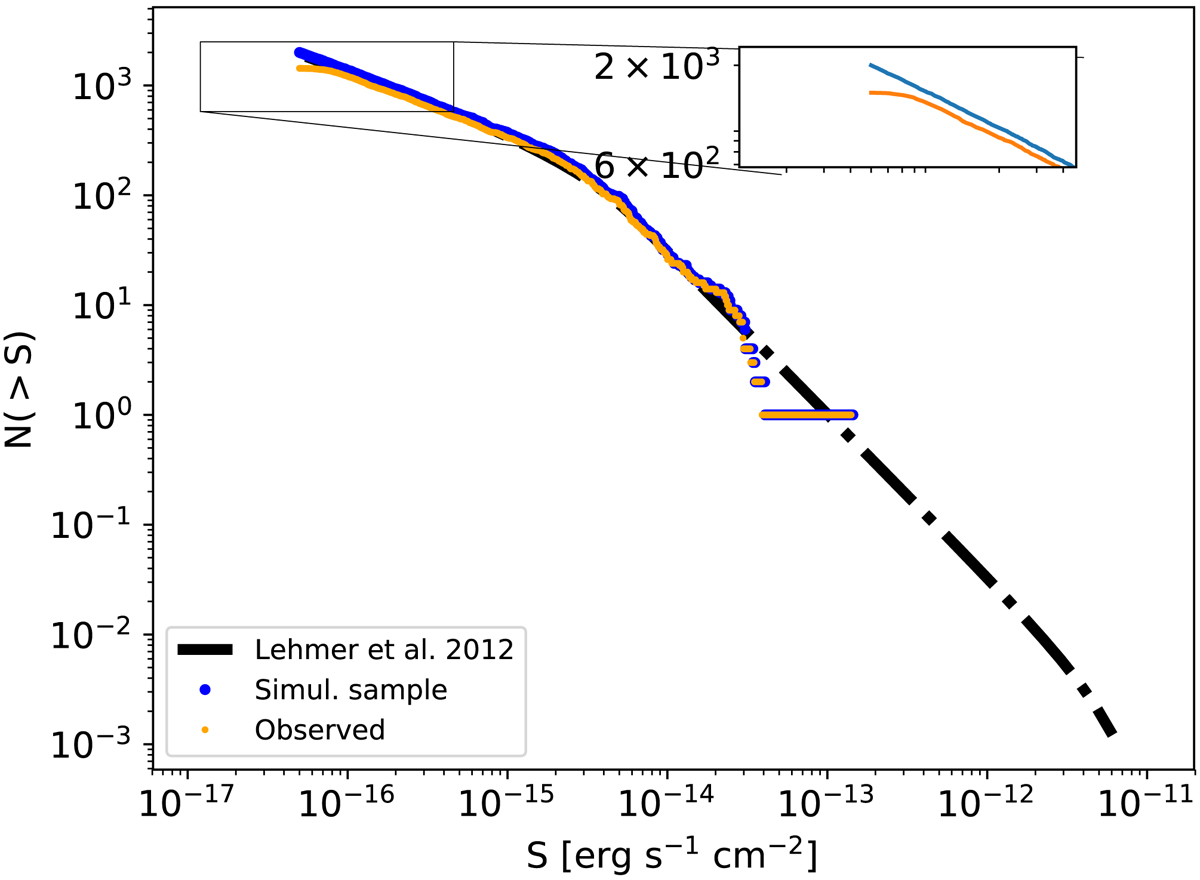
Simulated AGN log N − log S relation. The black curve is the AGN model in the 0.5 − 2.0 keV energy band from Lehmer et al. (2012); the blue dotted curve represents one realization of an AGN population used for the simulation, while the orange dots are the detected AGNs. The zoom-in box shows the log N − log S relation at the faint end, which indicates ATHENA cannot detect any sources fainter than (7 × 10⁻¹⁷ ergs s−1 cm−2) in an 80 ks exposure time observation.
Current usage metrics show cumulative count of Article Views (full-text article views including HTML views, PDF and ePub downloads, according to the available data) and Abstracts Views on Vision4Press platform.
Data correspond to usage on the plateform after 2015. The current usage metrics is available 48-96 hours after online publication and is updated daily on week days.
Initial download of the metrics may take a while.