Fig. 13.
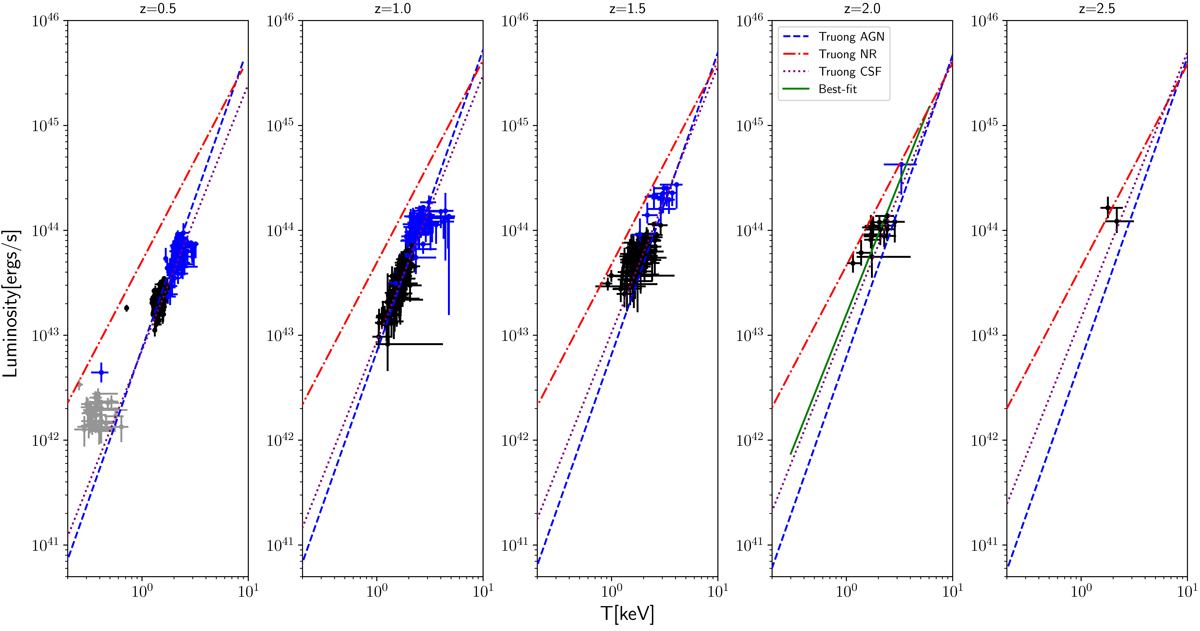
Observed LX − T relation based on TR18 CSF simulation. The TR18 NR, CSF, and AGN models are shown in red (dash-dotted), purple (dotted), and blue (dashed) lines. The gray, black, and blue data points represent the simulations with masses of M500 = 1013 M⊙, 5 × 10¹³ M⊙, and 1014 M⊙ respectively. The number of data points are the expected number of groups to be detected by ATHENA for the TR18 CSF model (which is given in the middle values in Table 2). No data points are shown for the mass of M500 = 1013 M⊙ beyond z ≥ 1.0 due to the zero detection probability predicted in panel 5 of Fig. 9. The solid green line is the linear fit result with a fixed slope from the TR18 CSF model.
Current usage metrics show cumulative count of Article Views (full-text article views including HTML views, PDF and ePub downloads, according to the available data) and Abstracts Views on Vision4Press platform.
Data correspond to usage on the plateform after 2015. The current usage metrics is available 48-96 hours after online publication and is updated daily on week days.
Initial download of the metrics may take a while.