Fig. 12.
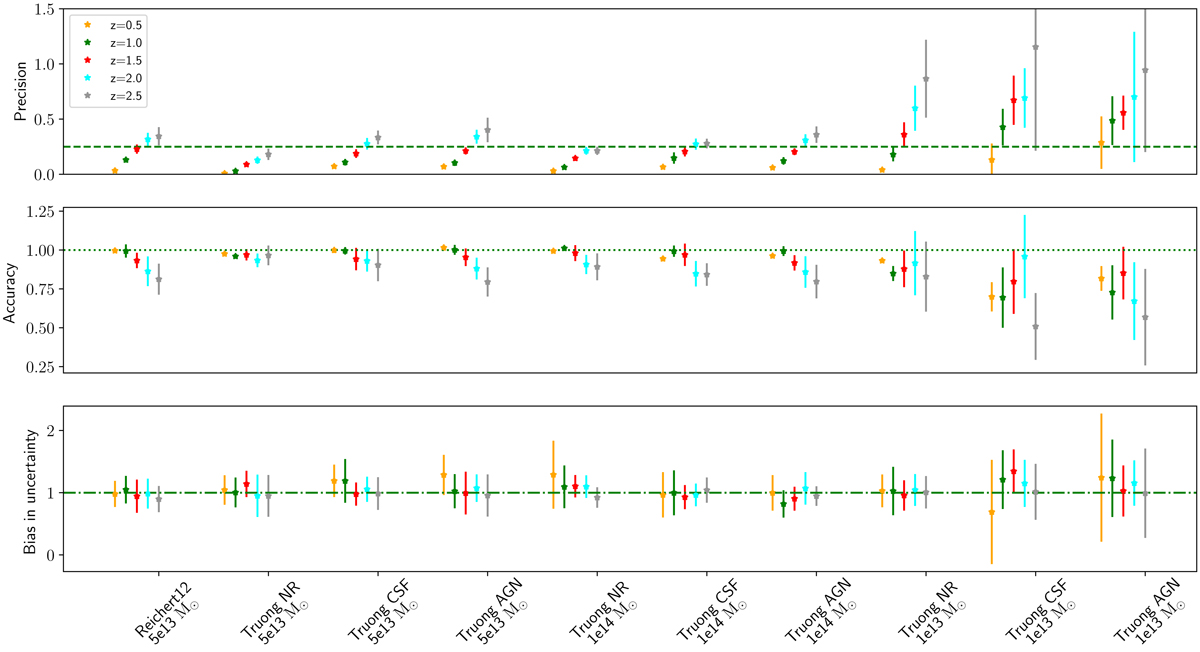
Temperature statistics for the simulations by RE11 and TR18 (Truong NR, Truong CSF and Truong AGN) in 80 ks exposure time, with masses of M500 = 1 × 10¹³ M⊙, 5 × 10¹³ M⊙ and 1014 M⊙. Top: median precision of the temperature fit. The green dashed line indicates 25% precision. Middle: accuracy of the temperature measurements. Bottom: bias in uncertainty. The precision, accuracy, and bias in uncertainty are defined in Sect. 3.2.5.
Current usage metrics show cumulative count of Article Views (full-text article views including HTML views, PDF and ePub downloads, according to the available data) and Abstracts Views on Vision4Press platform.
Data correspond to usage on the plateform after 2015. The current usage metrics is available 48-96 hours after online publication and is updated daily on week days.
Initial download of the metrics may take a while.