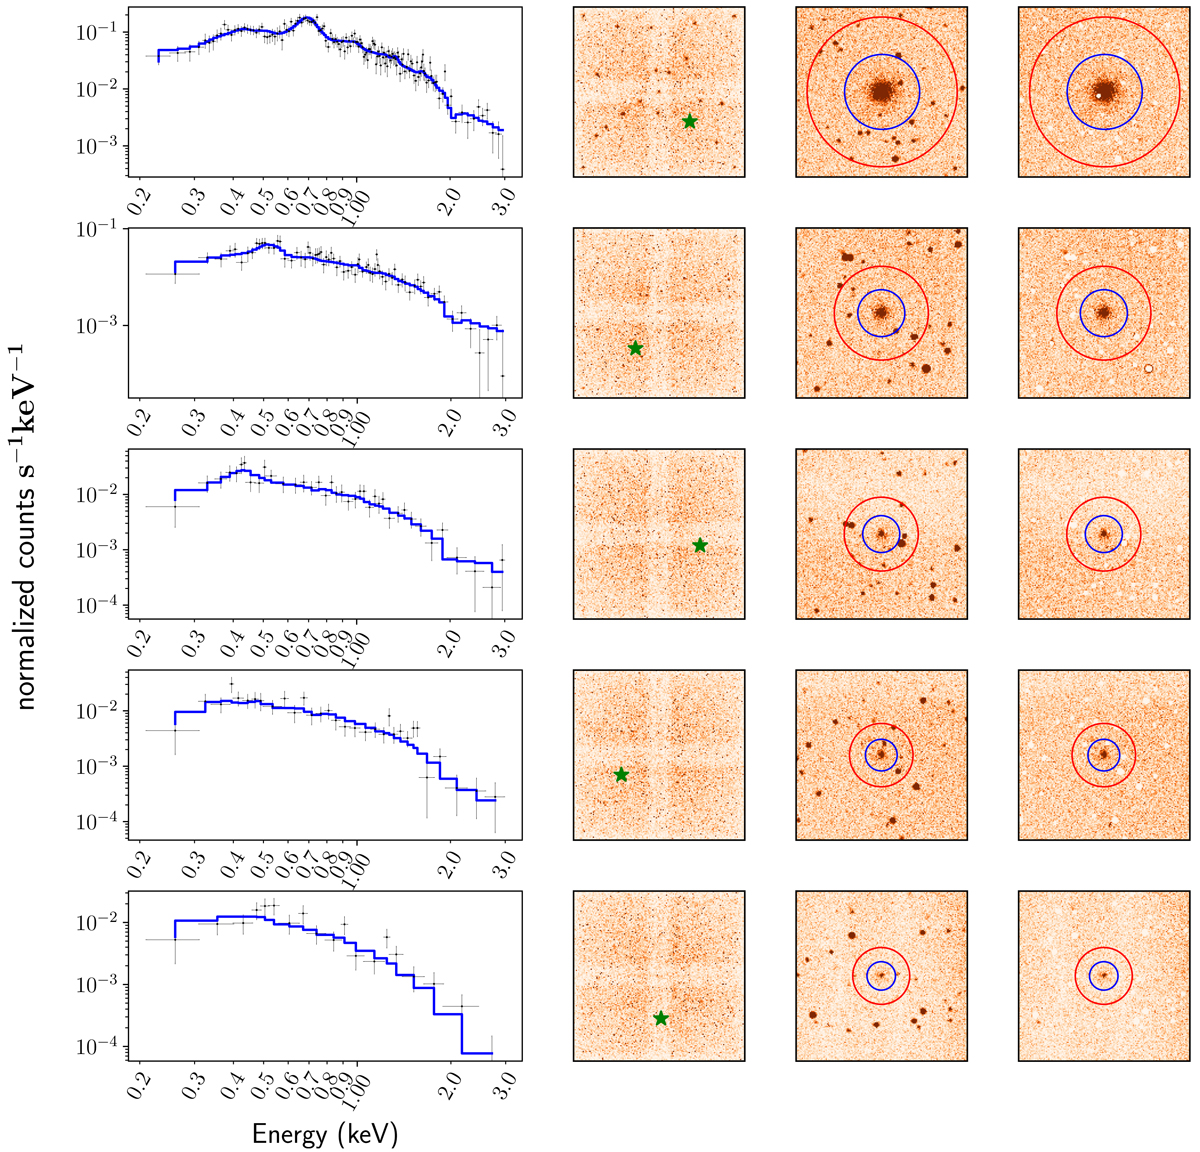
Fig. 11.

Simulated background-subtracted WFI spectrum of a 5 × 10¹³ M⊙ group at z = 0.5, 1.0, 1.5, 2.0, 2.5 (from top to bottom), at an off-axis angle of 10′, and an exposure time of 80 ks. First panel (from the left): galaxy group spectra with the background subtracted. Second panel: extracted location of galaxy group in ATHENA FoV. Third panel: zoom-in view of the galaxy groups (box size 6′×6′); the blue circle represents r500; the red circle is 2.0 × r500; the annulus is used for background subtraction. Fourth panel: detected AGNs are excluded with a PSF corresponding to a 90% encircled energy fraction (99% for the bright ones outside r500).
Current usage metrics show cumulative count of Article Views (full-text article views including HTML views, PDF and ePub downloads, according to the available data) and Abstracts Views on Vision4Press platform.
Data correspond to usage on the plateform after 2015. The current usage metrics is available 48-96 hours after online publication and is updated daily on week days.
Initial download of the metrics may take a while.


