Fig. 8
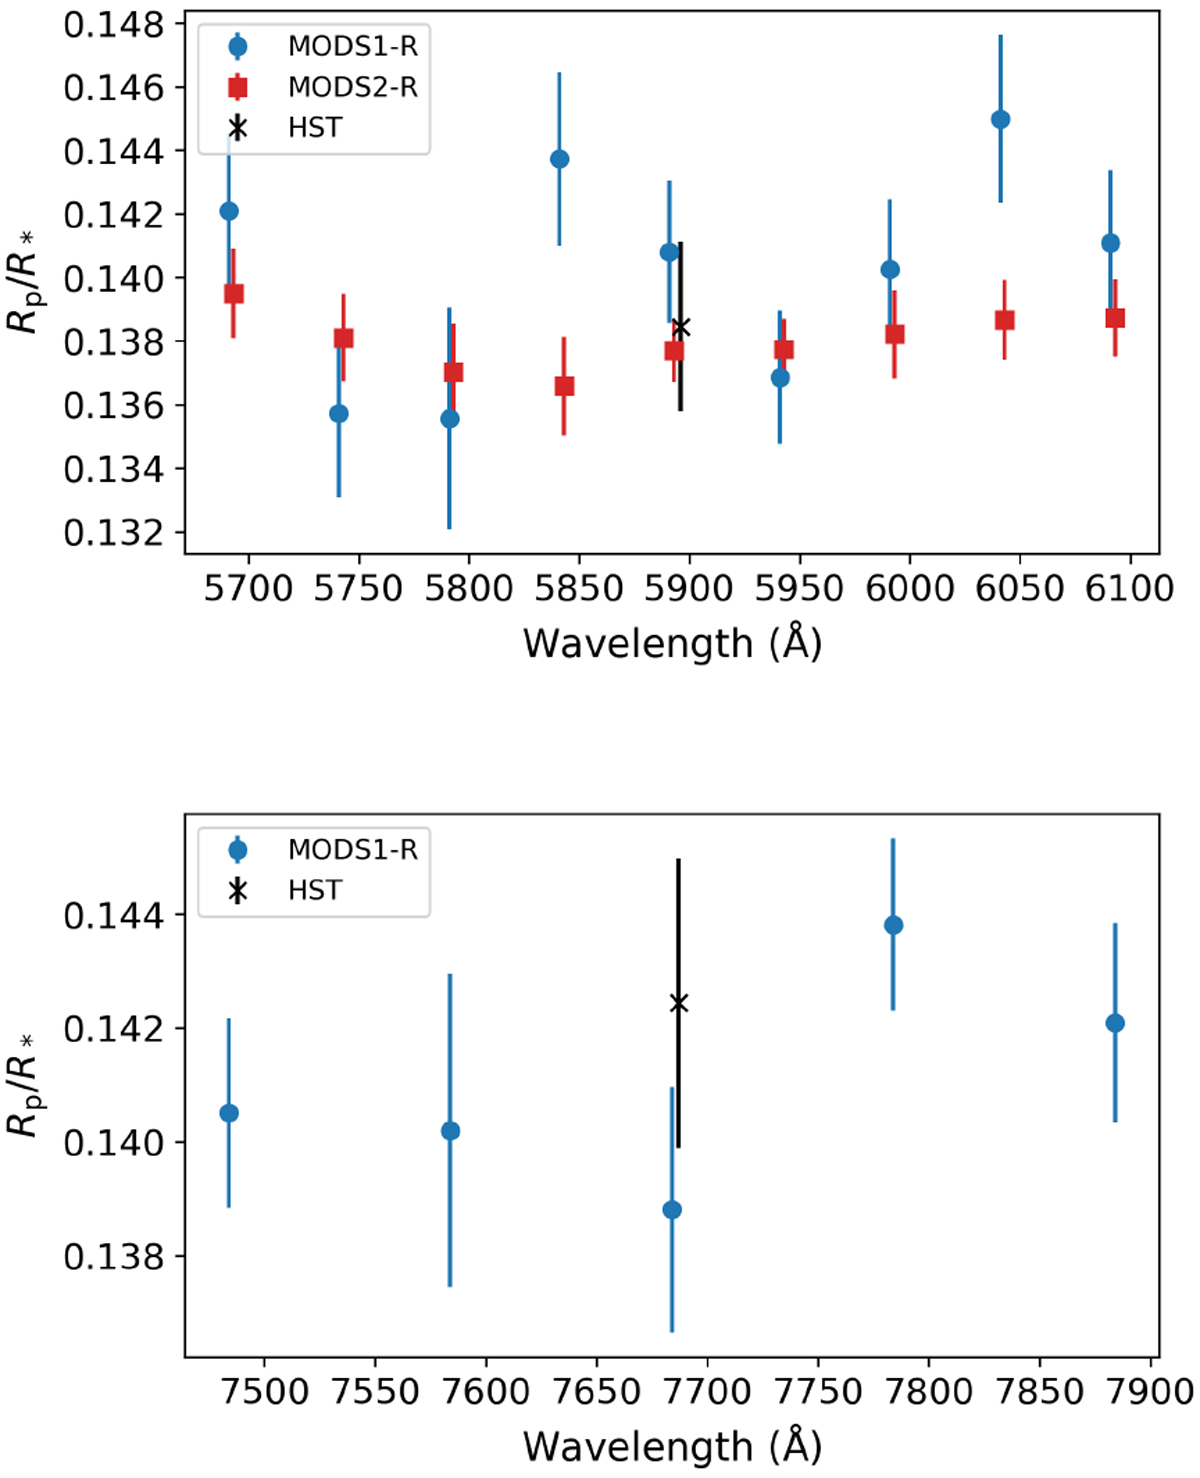
Transmission spectra around the Na feature (upper panel) and K feature (lower panel). The bin size is 50 Å for Na and 100 Å for K. The values of Na and K bins from the HST observation (A2018) are also plotted as black points. The LBT results have similar or even smaller errors than the HST data points. The spectra are in general flat. The wavelengths from different observations are slightly shifted for clarity.
Current usage metrics show cumulative count of Article Views (full-text article views including HTML views, PDF and ePub downloads, according to the available data) and Abstracts Views on Vision4Press platform.
Data correspond to usage on the plateform after 2015. The current usage metrics is available 48-96 hours after online publication and is updated daily on week days.
Initial download of the metrics may take a while.