Free Access
Fig. 7
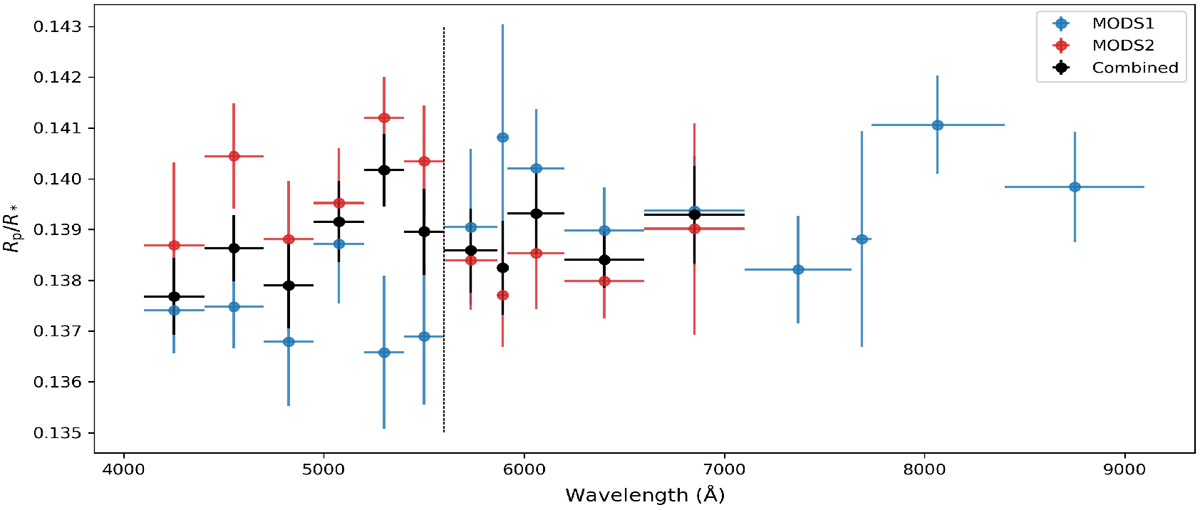
Transmission spectra of HAT-P-12b from the LBT/MODS observation. The blue and red points are the spectra from MODS1 and MODS2, respectively. The black points are the average spectrum. The vertical dashed line indicates the wavelength boundary between the blue and red channels.
Current usage metrics show cumulative count of Article Views (full-text article views including HTML views, PDF and ePub downloads, according to the available data) and Abstracts Views on Vision4Press platform.
Data correspond to usage on the plateform after 2015. The current usage metrics is available 48-96 hours after online publication and is updated daily on week days.
Initial download of the metrics may take a while.