Fig. 4
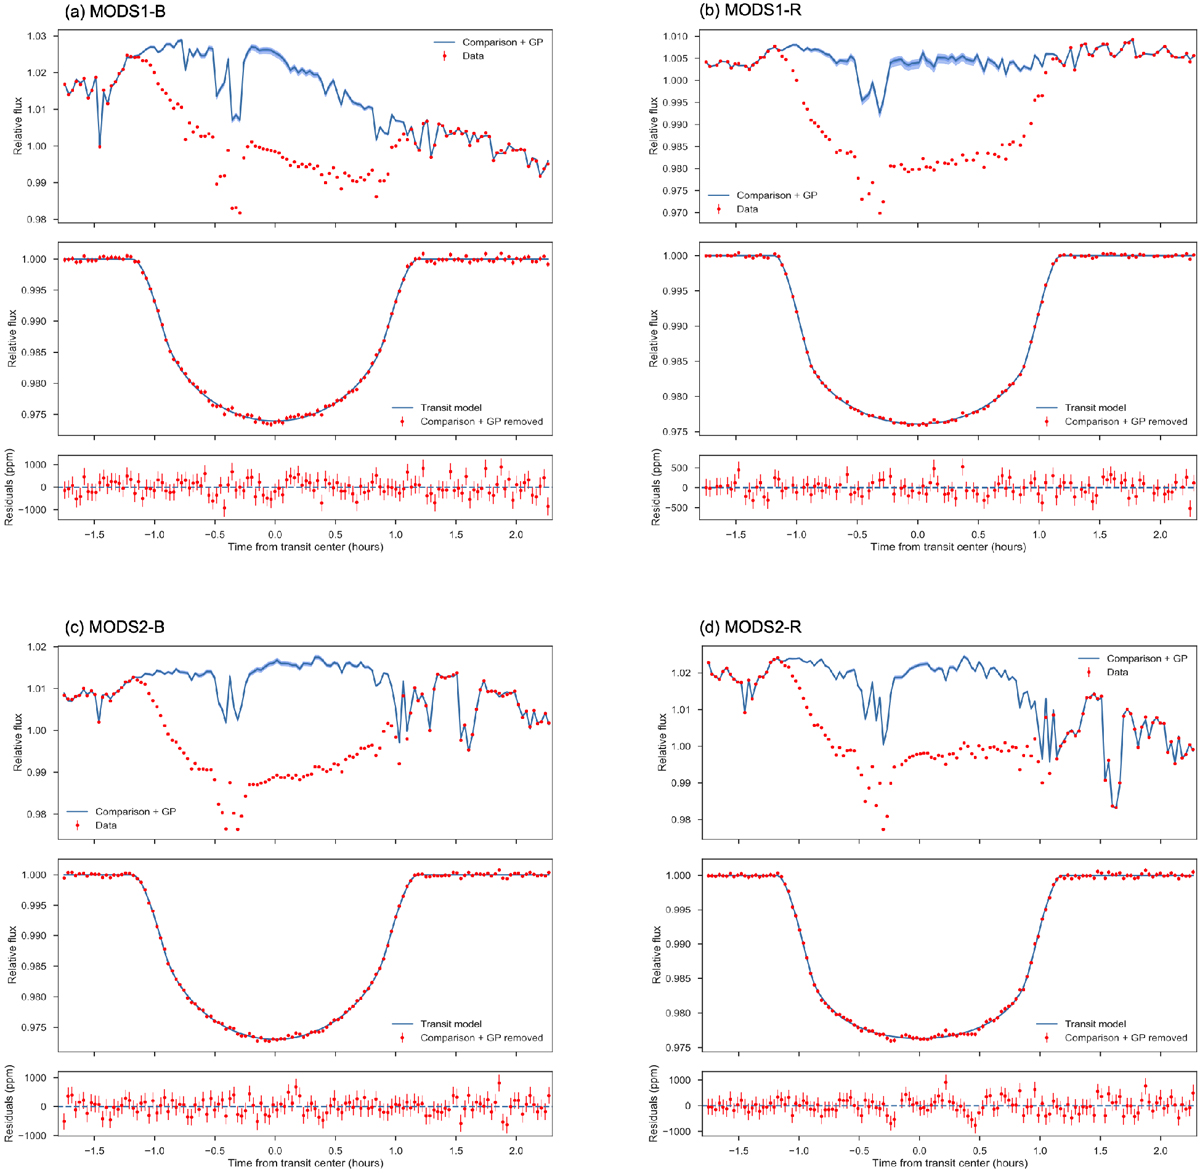
White-light curves for the four MODS channels. Upper: raw white-light curves of the target star together with the systematic models. Here the systematic model contains the light curve of the comparison star and the GP components. Middle: light curve after the removal of the comparison star and GP components. The best-fit transit model is also presented. Bottom: residuals between the observation and model.
Current usage metrics show cumulative count of Article Views (full-text article views including HTML views, PDF and ePub downloads, according to the available data) and Abstracts Views on Vision4Press platform.
Data correspond to usage on the plateform after 2015. The current usage metrics is available 48-96 hours after online publication and is updated daily on week days.
Initial download of the metrics may take a while.