Free Access
Fig. 3
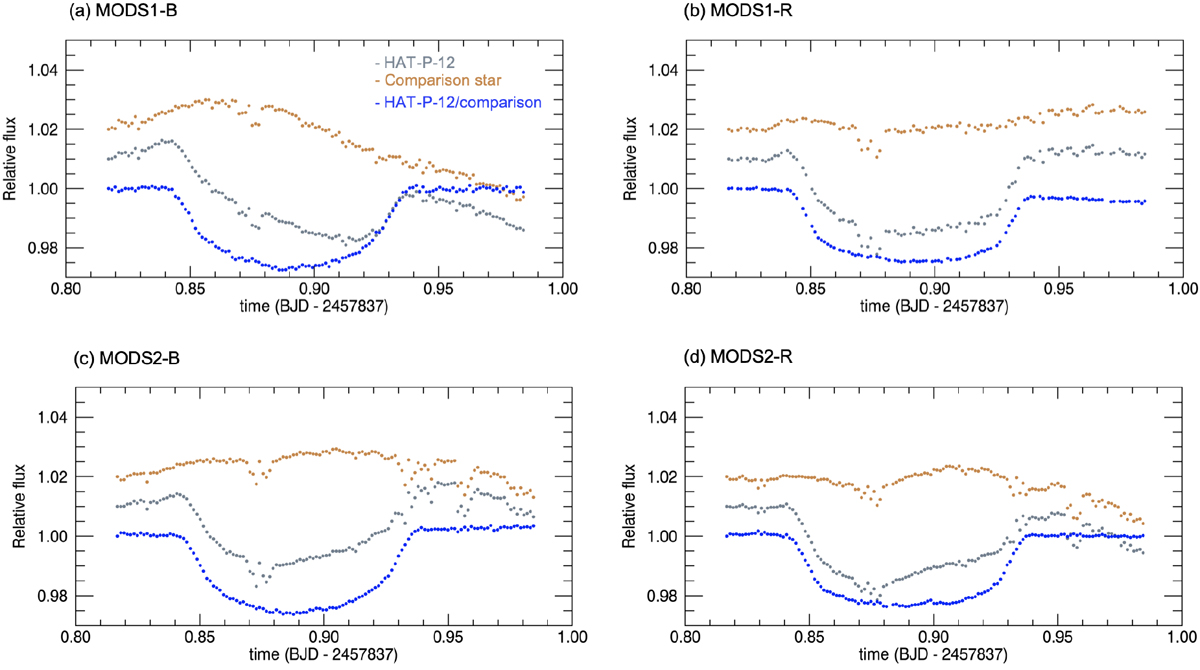
Raw white-light curves of the target star (gray points) and the comparison star (yellow points) for the four channels. The blue points are the ratio between the target star and the comparison star. The light curves are the normalized fluxes with constant offsets.
Current usage metrics show cumulative count of Article Views (full-text article views including HTML views, PDF and ePub downloads, according to the available data) and Abstracts Views on Vision4Press platform.
Data correspond to usage on the plateform after 2015. The current usage metrics is available 48-96 hours after online publication and is updated daily on week days.
Initial download of the metrics may take a while.