Free Access
Fig. 2
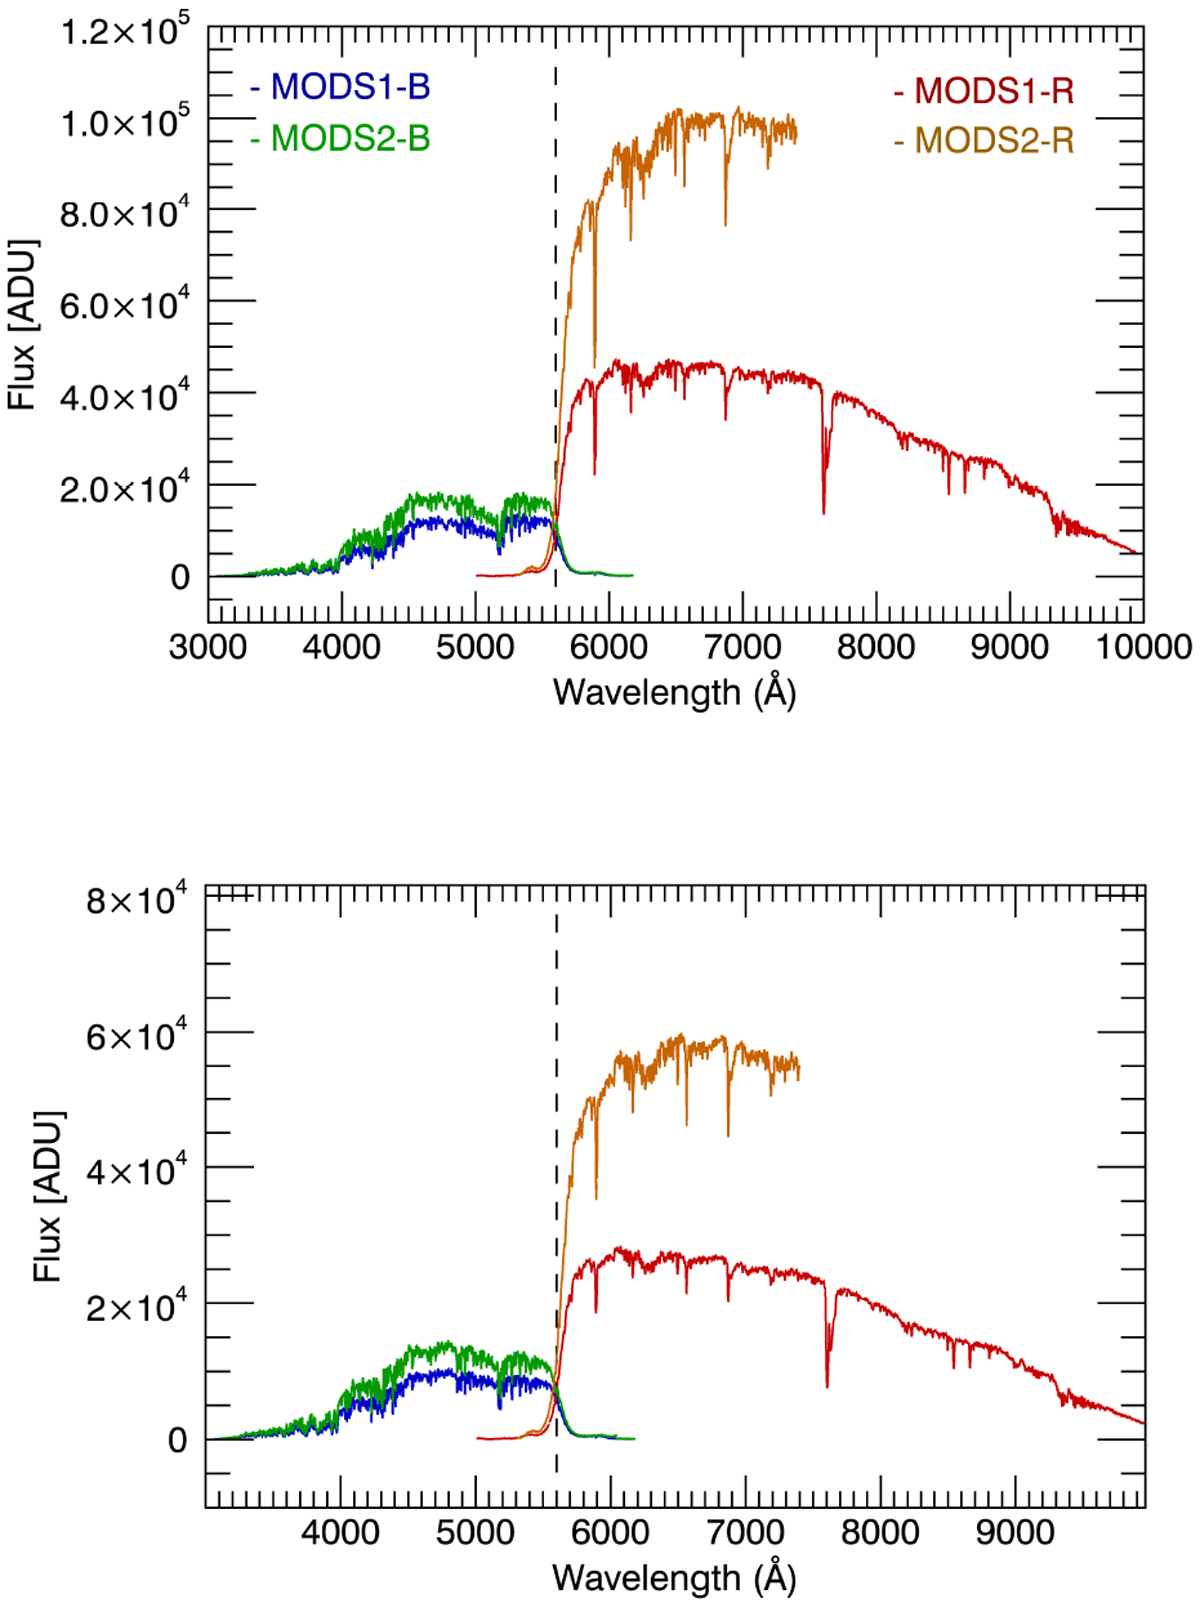
Example of the extracted spectra of HAT-P-12 (upper panel) and the comparison star (lower panel). These spectra were obtained simultaneously from the red and blue channels of the MODS1 and MODS2 spectrographs.
Current usage metrics show cumulative count of Article Views (full-text article views including HTML views, PDF and ePub downloads, according to the available data) and Abstracts Views on Vision4Press platform.
Data correspond to usage on the plateform after 2015. The current usage metrics is available 48-96 hours after online publication and is updated daily on week days.
Initial download of the metrics may take a while.