Fig. 11
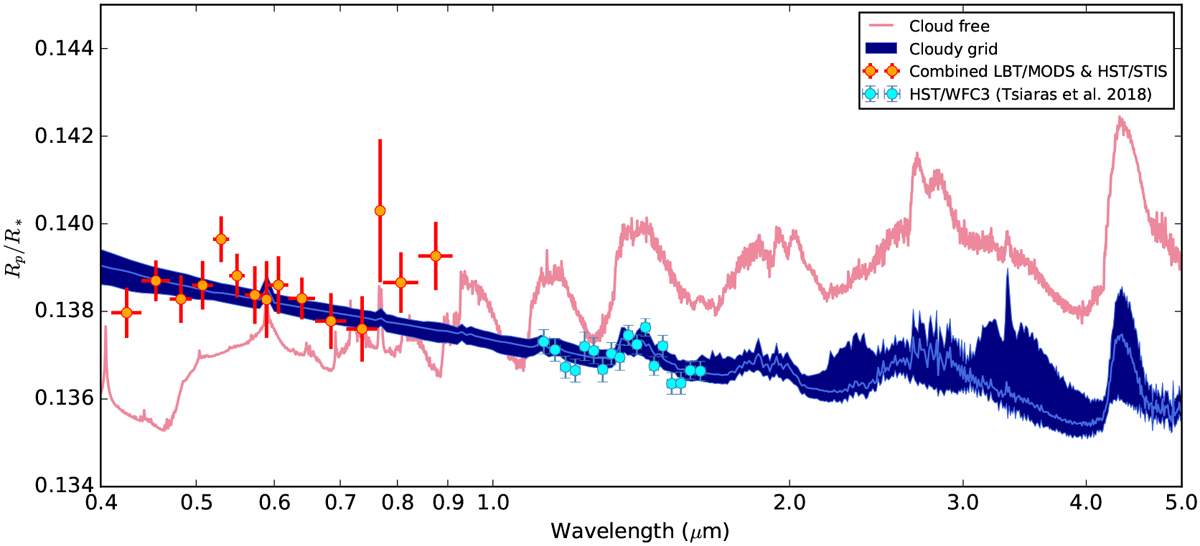
Combined spectrum of HAT-P-12b and the best atmospheric models fitted to this spectrum. The red points are the average of our LBT/MODS spectrum and the reanalyzed HST/STIS spectrum from A2018. The HST/WFC3 data (blue points) are also included in the model fit. The best-fit cloud-free model with no constraint on the atmospherictemperature (red) disagrees with the observations. The blue shadow denotes the best cloudy models with 1σ confidence region. The models are self-consistently calculated with petitCODE. The retrieved parameters are shown in Table 5.
Current usage metrics show cumulative count of Article Views (full-text article views including HTML views, PDF and ePub downloads, according to the available data) and Abstracts Views on Vision4Press platform.
Data correspond to usage on the plateform after 2015. The current usage metrics is available 48-96 hours after online publication and is updated daily on week days.
Initial download of the metrics may take a while.